Complete Guide to 10x Genomics Single-Cell RNA Sequencing in Plant Tissues: From Cell Wall Digestion to Data Analysis
This comprehensive guide provides researchers, scientists, and drug development professionals with an in-depth protocol for successful 10x Genomics single-cell RNA sequencing (scRNA-seq) in plant tissues.
Complete Guide to 10x Genomics Single-Cell RNA Sequencing in Plant Tissues: From Cell Wall Digestion to Data Analysis
Abstract
This comprehensive guide provides researchers, scientists, and drug development professionals with an in-depth protocol for successful 10x Genomics single-cell RNA sequencing (scRNA-seq) in plant tissues. Covering foundational principles, optimized tissue dissociation methods, critical troubleshooting steps for plant-specific challenges, and validation strategies against traditional bulk RNA-seq, the article serves as an essential resource for unlocking plant cellular heterogeneity. It addresses unique obstacles such as cell wall removal, protoplast viability, and chloroplast RNA depletion, enabling robust single-cell studies in plant developmental biology, stress responses, and the discovery of bioactive compounds for pharmaceutical applications.
Understanding Plant scRNA-seq: Why 10x Genomics is a Game-Changer for Unlocking Cellular Heterogeneity
The Shift from Bulk to Single-Cell Analysis
Bulk RNA sequencing (RNA-seq) has been instrumental in plant biology, providing average gene expression profiles for entire tissues or organs. However, this approach masks the heterogeneity inherent within plant tissues, which are composed of diverse cell types (e.g., epidermis, mesophyll, vasculature) and states. Single-cell RNA sequencing (scRNA-seq), particularly with droplet-based platforms like 10x Genomics, resolves this by profiling gene expression in individual cells, enabling the discovery of novel cell types, developmental trajectories, and nuanced responses to stimuli.
Table 1: Key Comparative Metrics: Bulk RNA-seq vs. 10x Genomics scRNA-seq for Plant Tissue
| Metric | Bulk RNA-Seq | 10x Genomics scRNA-seq (Plant Protoplasts) |
|---|---|---|
| Resolution | Tissue-average | Single-cell (1,000 - 10,000 cells per run) |
| Cell Type Detection | Inferred, deconvoluted | Directly identified and characterized |
| Key Output | Differential expression between conditions | Cell-type specific DE, developmental trajectories, rare cell populations |
| Typical Required Cell Number | Millions | Tens of thousands (after protoplasting) |
| Major Challenge for Plants | N/A | Efficient protoplasting without stress-induced transcriptional changes |
Core Protocol: Plant Tissue Protoplasting and 10x Genomics Library Preparation
This protocol is central to the thesis research on adapting 10x Genomics solutions for complex plant tissues.
Reagents and Equipment (The Scientist's Toolkit)
Table 2: Essential Research Reagent Solutions for Plant scRNA-seq
| Item | Function | Example/Note |
|---|---|---|
| Cell Wall Digesting Enzymes | Generate protoplasts by degrading pectin and cellulose. | Macerozyme R-10 (pectin), Cellulase R-10 (cellulose). Must be high purity. |
| Osmoticum | Maintain osmotic balance to prevent protoplast lysis. | Mannitol (0.4-0.6 M) or sorbitol in digestion and wash buffers. |
| Protoplast Washing Buffer | Gently cleanse protoplasts of enzymes and debris. | Often based on MgCl2 or CaCl2 with osmoticum. |
| Viability Stain | Assess protoplast integrity and health pre-sequencing. | Fluorescein diacetate (FDA) or propidium iodide (PI). |
| 10x Genomics Chromium Controller & Kit | Partition single cells with barcoded beads for library prep. | Chromium Next GEM Single Cell 3' Reagent Kits v3.1. |
| Cell Strainer | Remove undigested tissue and clumps. | Nylon mesh, 30-70 µm pore size. |
| PCR Tubes/Cycler | Amplify cDNA and final libraries. | Must be high-fidelity, low-bias amplification. |
Detailed Methodology
Part A: Protoplast Isolation from Arabidopsis Root/Leaf
- Tissue Harvest & Digestion: Excise ~1g of fresh tissue. Slice finely with a razor blade in a digestion solution (1.5% Cellulase R-10, 0.4% Macerozyme R-10, 0.4M mannitol, 10mM MES pH 5.7, 10mM CaCl2, 0.1% BSA).
- Vacuum Infiltrate: Apply gentle vacuum for 15-20 minutes to infiltrate tissues with enzyme solution.
- Digest: Incubate in the dark with gentle shaking (40-60 rpm) for 2-4 hours at 22-25°C.
- Filter: Pass the digestate through a 40 µm cell strainer into a 50 mL tube.
- Wash: Pellet protoplasts by centrifugation at 100-300 x g for 5 minutes. Gently resuspend in 10 mL Wash Buffer (0.4M mannitol, 10mM MES pH 5.7, 5mM CaCl2). Repeat 2x.
- Count & Quality Control: Count using a hemocytometer. Assess viability via FDA/PI staining. Target viability >85%. Adjust concentration to 700-1,200 cells/µL in Wash Buffer for 10x loading.
Part B: 10x Genomics GEM Generation & Library Prep
- Target Recovery: Aim to load ~10,000 cells for a target recovery of 5,000-8,000 cells.
- GEM Generation: Load Chromium Chip B with protoplast suspension, Master Mix, and Partitioning Oil per manufacturer's instructions on the Chromium Controller.
- Reverse Transcription & Barcoding: Incubate GEMs for cDNA synthesis. The unique barcode on each bead tags all mRNA from a single cell.
- Cleanup & Amplification: Break emulsions, purify cDNA with DynaBeads, and amplify by PCR (12-14 cycles).
- Library Construction: Fragment, A-tail, index, and ligate adaptors to create sequencing-ready libraries.
- QC & Sequencing: Assess library size (~500 bp) on a Bioanalyzer. Sequence on Illumina platforms (NovaSeq 6000) aiming for ~50,000 reads/cell.
Key Application Notes from Current Literature
Table 3: Quantitative Outcomes from Recent Plant scRNA-seq Studies
| Plant Species | Tissue | Cells Recovered | Key Finding | Citation (Example) |
|---|---|---|---|---|
| Arabidopsis thaliana | Root Tip | 3,121 | Identified novel cell-type specific markers and transitional states in the elongation zone. | Denyer et al., 2019 |
| Arabidopsis thaliana | Leaf Mesophyll | ~5,000 | Mapped the transcriptional continuum of photosynthesis adaptation at single-cell resolution. | Liu et al., 2020 |
| Oryza sativa (Rice) | Root | 12,421 | Constructed a comprehensive root cell atlas and inferred relatedness in developmental lineages. | Zhang et al., 2021 |
| Zea mays (Maize) | Shoot Apical Meristem | 10,000+ | Deconstructed meristem zonation and identified regulators of stem cell fate. | Satterlee et al., 2020 |
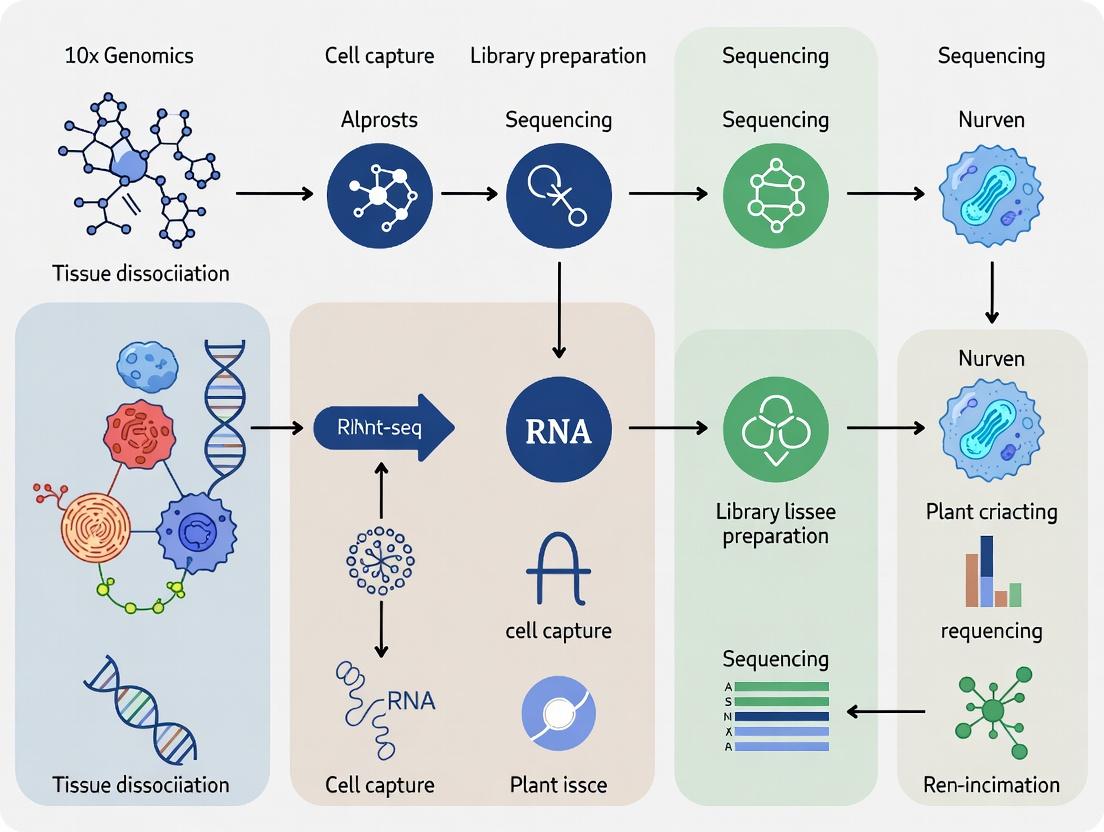
Visualizing Workflows and Pathways
Diagram Title: Plant scRNA-seq Workflow from Tissue to Data
Diagram Title: scRNA-seq Uncovers Cell-Type Specific Stress Pathways
Application Notes
Within the context of a thesis focused on adapting single-cell RNA sequencing for challenging plant tissues, the core 10x Genomics Chromium platform principles enable the high-throughput analysis of individual plant cells. The system addresses key obstacles in plant biology, such as cell wall digestion, protoplast viability, and transcriptome capture efficiency. The foundational Gel Beads-in-Emulsion (GEM) technology allows for the simultaneous barcoding of thousands of individual plant cell transcripts, facilitating the reconstruction of cell-type-specific gene expression profiles from complex tissues like root, leaf, or meristem.
Quantitative Performance Metrics
Table 1: Key Performance Metrics of the 10x Genomics Chromium Platform (Single Cell 3' Reagent Kits v3.1/v4.0)
| Metric | Specification | Notes for Plant Tissue Applications |
|---|---|---|
| Cells Recoverable per Channel | 10,000 (target) | Actual recovery depends on protoplast yield and viability. |
| Cell Throughput per Run | Up to 80,000 (8 channels) | Enables profiling of entire tissue systems. |
| GEM Generation Rate | >100,000 per run | Ensures high cell capture efficiency. |
| Barcode Specificity | >99.9% | Minimizes ambient RNA misassignment. |
| Sequencing Saturation | Recommended: 50-70% | Higher saturation needed for detecting low-abundance plant transcripts. |
| Median Genes per Cell | 1,000 - 10,000 (mammalian) | Typically lower for plant protoplasts due to RNA loss during isolation. |
| Recommended Read Depth | 20,000 - 50,000 reads/cell | May increase for complex plant genomes. |
Table 2: Critical Considerations for Plant Protoplast Workflows
| Parameter | Optimal Range | Impact on GEM/Barcoding |
|---|---|---|
| Protopast Concentration | 700-1,200 cells/µL | Critical for achieving optimal cell capture rate. |
| Protoplast Viability | >80% | Reduces background from lysed cells. |
| Input Cell Volume | 40.6 µL | Fixed by Chromium chip. |
| Ambient RNA | Minimize with washes | Major challenge in plant samples; use of nuclease inhibitors advised. |
| Cell Size | < 40 µm diameter | Larger plant protoplasts may clog microfluidic circuits. |
Protocols
Protocol 1: Preparation of Plant Single-Cell Suspensions for Chromium Input
Objective: Generate viable, intact protoplasts at the correct concentration for GEM generation.
- Tissue Digestion: Finely slice 0.5-1g of fresh plant tissue. Incubate in enzyme solution (e.g., 1.5% Cellulase R10, 0.4% Macerozyme R10, 0.4M Mannitol, 10mM MES pH 5.7, 10mM CaCl₂, 0.1% BSA) for 2-6 hours at 25°C in the dark with gentle shaking.
- Protoplast Filtration & Washing: Filter suspension through 40-70µm nylon mesh. Wash filtrate with 10mL of W5 solution (154mM NaCl, 125mM CaCl₂, 5mM KCl, 2mM MES pH 5.7) by centrifugation at 100-300g for 5 minutes. Repeat wash.
- Viability Assessment & Concentration: Resuspend pellet in 1mL of sorting buffer (e.g., 1x PBS, 0.4M Mannitol, 0.1% BSA). Count and assess viability using Trypan Blue or Fluorescein Diacetate (FDA) staining. Adjust concentration to 700-1,200 viable cells/µL.
Protocol 2: GEM Generation and Barcoding on the Chromium Controller
Objective: Partition single plant cells with barcoded gel beads and reagents to create uniquely indexed GEMs.
- Chip Priming: Load the specified Chromium chip (e.g., Chip B) onto the Chromium Controller. Pipette 115µL of RT Reagent Master Mix into the left well marked "Gel Bead & Master Mix". Pipette 115µL of Partitioning Oil into the right well marked "Oil".
- Sample Loading: Pipette 40.6µL of the prepared plant single-cell suspension (from Protocol 1) into the middle well marked "Sample".
- Run Controller: Initiate the "Chromium Single Cell 3'" run program. The microfluidic circuitry will:
- Co-partition single cells, a single Gel Bead, and Master Mix into ~100,000 oil droplets (GEMs).
- The Gel Bead dissolves, releasing oligonucleotides containing: (i) a 16bp 10x Barcode (shared by all transcripts from that GEM), (ii) a 10bp Unique Molecular Identifier (UMI), and (iii) a 30bp Poly-dT sequence.
- Within each GEM, reverse transcription occurs, generating cDNA tagged with the cell-specific barcode and UMI.
- Recovery: Post-run, transfer the GEM emulsion (~100µL) from the collection tube to a fresh tube for cleanup and amplification.
Protocol 3: Post-GEM Processing and Library Construction
Objective: Break emulsions, purify barcoded cDNA, and construct sequencing libraries.
- GEM-RT Cleanup: Add Recovery Agent to the GEMs, incubate, and break the emulsion. Purify barcoded, full-length cDNA using DynaBeads MyOne SILANE beads.
- cDNA Amplification: Amplify the purified cDNA via PCR (13 cycles recommended for plant samples). Clean up amplified cDNA using SPRIselect beads.
- Library Construction: Fragment the amplified cDNA, add adaptors via End Repair, A-tailing, and ligation. Perform a sample index PCR (12 cycles) to add P5, P7, and sample index sequences. Clean up final libraries with SPRIselect beads.
- QC & Sequencing: Quantify libraries using qPCR (e.g., KAPA Library Quantification Kit) and profile fragment size (e.g., Agilent Bioanalyzer High Sensitivity DNA chip). Pool libraries and sequence on an Illumina platform (e.g., NovaSeq 6000) using recommended read lengths: Read 1: 28 cycles (10x Barcode + UMI), i7 Index: 10 cycles, i5 Index: 10 cycles, Read 2: 90 cycles (transcript).
Diagrams
GEM Formation and Barcoding Process
Barcode and UMI Function in Transcript Tagging
The Scientist's Toolkit
Table 3: Essential Research Reagent Solutions for 10x Genomics Plant scRNA-seq
| Item | Function in Protocol | Key Consideration for Plant Samples |
|---|---|---|
| Chromium Single Cell 3' Reagent Kits (v3.1/v4.0) | Provides all essential reagents for GEM generation, barcoding, RT, and library prep. | Use latest version for improved sensitivity. Compatible with custom enzyme mixes for protoplasting. |
| Chromium Chip B (or X) | Microfluidic device for partitioning cells into GEMs. | Single-use. Ensure protoplast size is within chip specification to prevent clogging. |
| Partitioning Oil | Immiscible phase to create stable water-in-oil emulsions (GEMs). | Provided in kit. Critical for droplet integrity. |
| Cellulase/Macerozyme Enzymes | Digest plant cell walls to release protoplasts. | Concentration and incubation time must be optimized for each tissue type to maximize yield/viability. |
| Osmoticum (e.g., Mannitol) | Maintains osmotic balance to prevent protoplast lysis. | Typically used at 0.4-0.6M in isolation and resuspension buffers. |
| DynaBeads MyOne SILANE Beads | Solid-phase reversible immobilization (SPRI) for nucleic acid cleanup post-GEM. | Size selection ratios are critical for library quality. |
| SPRIselect Beads | Post-amplification and post-ligation cleanup and size selection. | Adjust bead-to-sample ratio per protocol to exclude primer dimers. |
| Nuclease Inhibitors (e.g., RNase Inhibitor) | Protects RNA from degradation during protoplast isolation. | Essential due to high RNase activity in many plant tissues. |
| Viability Stain (FDA/Propidium Iodide) | Assesses health of protoplast suspension prior to loading. | High viability (>80%) is crucial for reducing background from lysed cells. |
Application Notes
The application of 10x Genomics single-cell RNA sequencing (scRNA-seq) to plant tissues presents unique and formidable challenges distinct from animal systems. These stem primarily from three interconnected structural and biochemical features: the rigid cell wall, the dominant vacuole, and the abundance of secondary metabolites. Successfully navigating these obstacles is critical for generating high-quality, biologically relevant single-cell data to advance research in plant development, stress responses, and the biosynthesis of high-value pharmaceutical compounds.
1. The Cell Wall Barrier: The polysaccharide-rich cell wall impedes gentle and efficient protoplast (isolated plant cell) generation. Enzymatic digestion must be optimized to liberate cells without inducing severe stress responses that distort the transcriptome. Unlike animal tissues, mechanical dissociation is largely ineffective, making the choice and combination of cell wall-degrading enzymes (e.g., cellulases, pectinases, hemicellulases) tissue-specific and critical.
2. Vacuolar Dominance and Cytoplasm Dilution: The large central vacuole can constitute over 90% of the cell volume. Upon protoplasting, the vacuole often bursts, diluting the cytoplasmic mRNA with hydrolytic enzymes and secondary metabolites, leading to rapid RNA degradation and poor cDNA yield. Strategies to stabilize protoplasts, such as osmotic protection and the use of RNase inhibitors, are non-negotiable.
3. Interference from Secondary Metabolites: Plants produce a vast array of secondary metabolites (e.g., phenolics, alkaloids, terpenes) that can co-purify with RNA, inhibiting downstream enzymatic reactions in the 10x Genomics workflow, including reverse transcription and PCR amplification. These compounds often oxidize, forming complexes that permanently damage nucleic acids.
Key Quantitative Considerations: The table below summarizes critical parameters and their impact on scRNA-seq outcomes.
| Challenge | Key Parameter | Target Range / Optimal State | Impact of Deviation |
|---|---|---|---|
| Protoplasting | Protoplast Viability | >85% (Post-digestion, Pre-filtration) | Low viability increases background noise from apoptotic cells. |
| Protoplasting | Protoplast Yield | 10^5 - 10^6 viable protoplasts per gram tissue | Low yield prevents capture of rare cell types; over-digestion reduces viability. |
| RNA Quality | RNA Integrity Number (RIN) | >8.0 (from bulk protoplast sample) | RIN <7.0 indicates degradation, leading to low gene detection per cell. |
| Secondary Metabolites | A260/A230 Ratio | >2.0 | Low ratio (<1.8) indicates contamination by phenolics/carbohydrates, causing RT/PCR inhibition. |
| 10x Library | Mean Reads per Cell | 20,000 - 50,000 | Lower reads reduce gene detection sensitivity. |
| 10x Library | Median Genes per Cell | 1,500 - 4,000 (Species/Tissue dependent) | Low genes/cell indicates poor RNA quality or inefficient capture. |
| Cell Doublet Rate | Estimated Doublet Rate | <5% (aligned to species karyotype) | High doublets confound cell type identification and differential expression. |
Experimental Protocols
Protocol 1: Robust Protoplast Isolation for scRNA-seq from Leaf Mesophyll
Principle: This protocol optimizes the digestion of cell walls from young leaf tissue while maintaining high protoplast viability and RNA integrity, using a mannitol-based osmoticum and a tailored enzyme mix.
Materials: See "Research Reagent Solutions" below. Workflow:
- Tissue Preparation: Harvest 0.5g of young, healthy leaf tissue. Sterilize if necessary. Slice into 0.5-1mm strips with a fresh razor blade in a Petri dish containing 5mL of Pre-plasmolysis Buffer.
- Pre-plasmolysis: Incubate sliced tissue in Pre-plasmolysis Buffer for 30 minutes at room temperature in the dark. This step reduces osmotic shock.
- Enzymatic Digestion: Replace solution with 10mL of freshly prepared Enzyme Digestion Solution. Vacuum infiltrate for 5 minutes to ensure infiltration. Incubate in the dark for 3-4 hours with gentle shaking (40 rpm).
- Protoplast Release & Filtration: Gently swirl the dish and pass the slurry through a 70μm Nylon Cell Strainer into a 50mL tube. Rinse the dish with 10mL of W5 Wash Solution and pass through the same strainer.
- Purification: Centrifuge filtrate at 100 x g for 5 minutes at 4°C. Carefully aspirate supernatant. Gently resuspend pellet in 1mL of ice-cold W5 Wash Solution.
- Viability & Yield Assessment: Mix 10μL of protoplast suspension with 10μL of 0.4% Trypan Blue. Count viable (unstained) and dead (blue) cells on a hemocytometer. Calculate viability and total yield.
- RNA Integrity Check (QC): Pellet 50,000 protoplasts (100 x g, 5 min, 4°C). Extract total RNA using a silica-membrane kit with β-mercaptoethanol. Assess RIN on a Bioanalyzer or TapeStation.
- Preparation for 10x: If QC passes (viability >85%, RIN >8.0), pellet required number of protoplasts (target 10,000 cells). Resuspend in PBS + 0.04% BSA at a density of 700-1,200 cells/μL. Keep on ice and proceed immediately to 10x Chromium controller.
Protocol 2: Polyvinylpyrrolidone (PVP)-Based RNA Extraction for Metabolite-Rich Tissues
Principle: This RNA extraction protocol incorporates high molecular weight PVP to bind and precipitate phenolic compounds, preventing their co-purification and subsequent inhibition of scRNA-seq library preparation.
Materials: See "Research Reagent Solutions" below. Workflow:
- Lysis: Lyse 100,000 protoplasts in 500μL of PVP Lysis Buffer by vortexing vigorously for 30 seconds.
- Deproteinization & Phenolic Removal: Add 500μL of Acid Phenol:Chloroform (pH 4.5). Vortex for 1 minute. Centrifuge at 12,000 x g for 10 minutes at 4°C.
- Aqueous Phase Recovery: Transfer the upper aqueous phase to a new tube. Add an equal volume of Chloroform:Isoamyl Alcohol (24:1). Vortex and centrifuge as in step 2.
- Precipitation: Transfer aqueous phase to a new tube. Add 1/10 volume of 3M Sodium Acetate (pH 5.2) and 2.5 volumes of ice-cold 100% ethanol. Mix and incubate at -80°C for 1 hour.
- Pellet & Wash: Centrifuge at 12,000 x g for 20 minutes at 4°C. Wash pellet with 1mL of 70% ethanol (made with DEPC-water). Centrifuge again for 5 minutes.
- Resuspension: Air-dry pellet for 5-10 minutes. Resuspend in 20μL of RNase-free water. Quantify with a spectrophotometer, ensuring A260/A230 >2.0 and A260/A280 ~2.0.
Visualizations
Diagram 1: Plant scRNA-seq Workflow with Key Challenges
Diagram 2: Metabolite Interference in scRNA-seq Pipeline
The Scientist's Toolkit: Research Reagent Solutions
| Item | Function in Protocol | Key Consideration |
|---|---|---|
| Macerozyme R-10 | Pectinase. Degrades middle lamella to separate cells. | Source from Rhizopus sp. Critical for tissue softening. |
| Cellulase RS | Cellulase. Digests primary cell wall cellulose microfibrils. | High purity reduces lot-to-lot variability in protoplast yield. |
| Driselase | Multi-enzyme complex (cellulase, hemicellulase, laminarinase). | Effective for complex tissues like roots or callus. |
| Mannitol (0.4-0.6 M) | Osmoticum. Maintains isotonic conditions to prevent protoplast bursting. | Concentration must be optimized for each tissue type. |
| Polyvinylpyrrolidone (PVP-40) | Phenolic scavenger. Binds to polyphenols during lysis, preventing oxidation and inhibition. | Essential for tissues like roots, bark, or wounded leaves. |
| β-Mercaptoethanol | Reducing agent. Inactivates RNases and inhibits polyphenol oxidases. | Added fresh to lysis and digestion buffers. |
| RNase Inhibitor (e.g., Recombinant) | Protects RNA from degradation during and after protoplasting. | More stable than traditional inhibitors like RNasin. |
| PBS + 0.04% BSA | 10x Genomics recommended resuspension buffer for plant protoplasts. | BSA reduces protoplast adhesion to tubing and wells. |
| 70μm Nylon Mesh | Filters out undigested tissue and large debris. | Prevents clogging of the 10x Chromium microfluidic chip. |
| Acid Phenol (pH 4.5) | Phase separation reagent for RNA extraction. Preferential partitioning of RNA to aqueous phase at acidic pH. | Key for effective removal of DNA and proteins. |
Application Notes
Developmental Trajectories in Plant Tissues
Recent scRNA-seq studies reveal cell-type-specific transcriptional programs driving organogenesis. Single-cell atlases of Arabidopsis thaliana roots and Zea mays leaves have cataloged over 20 distinct cell types, with pseudotime algorithms reconstructing continuous differentiation pathways.
Table 1: Key Metrics from Recent Plant scRNA-seq Studies
| Plant Species | Tissue | Approx. Cell Number | Cell Clusters Identified | Key Marker Genes | Reference Year |
|---|---|---|---|---|---|
| Arabidopsis thaliana | Root Tip | 12,000 | 15 | SCARECROW, SHORT-ROOT, WOODEN LEG | 2024 |
| Zea mays | Leaf Basal Meristem | 18,500 | 22 | KNOTTED1, WUSCHEL, ASYMMETRIC LEAVES1 | 2023 |
| Oryza sativa | Shoot Apical Meristem | 8,200 | 12 | OSH1, FON1, MOC1 | 2024 |
| Solanum lycopersicum | Fruit Pericarp | 10,300 | 14 | TAGL1, RIN, CNR | 2023 |
Deciphering Abiotic and Biotic Stress Responses
scRNA-seq enables the dissection of heterogeneous stress responses. Salt stress experiments in Arabidopsis root show 3 major responsive cell populations (cortex, endodermis, pericycle), with over 500 differentially expressed genes (DEGs) identified per population. Pathogen invasion studies (Pseudomonas syringae in leaf) reveal specialized responder cells comprising ~5% of the total mesophyll population.
Table 2: Quantitative Stress Response Signatures from scRNA-seq
| Stress Type | Plant System | Affected Cell Type(s) | Avg. DEGs/Cell Type | Key Upregulated Pathways | Notable Receptor(s) |
|---|---|---|---|---|---|
| Drought | Arabidopsis Root | Endodermis, Cortex | 420 | ABA Signaling, Proline Biosynthesis | PYL/RCAR ABA Receptors |
| Salt (150mM NaCl) | Arabidopsis Root | Cortex, Pericycle | 580 | SOS Pathway, Ion Homeostasis | SOS1 (Na+/H+ antiporter) |
| Fungal Pathogen (Blumeria) | Hordeum vulgare Leaf | Epidermal Cells | 750 | PR Protein Synthesis, Lignification | CERK1, EFR |
| Herbivore Attack | Nicotiana attenuata Leaf | Vein-Associated Cells | 320 | JA-Ile Signaling, Terpenoid Biosynthesis | COI1-JAZ Receptor |
Drug Discovery from Plant Compounds
scRNA-seq serves as a high-resolution tool for profiling the bioactivity of plant-derived compounds (e.g., phenolics, terpenoids, alkaloids) on human cell lines, elucidating precise mechanisms of action and identifying novel therapeutic targets.
Table 3: Bioactivity of Selected Plant Compounds from Recent Studies
| Plant Compound (Source) | Test System (Human Cell Line) | Concentration Range Tested | Key Affected Pathway(s) | Observed Phenotype | Potential Therapeutic Application |
|---|---|---|---|---|---|
| Curcumin (Curcuma longa) | A549 (Lung Carcinoma) | 5-50 µM | NF-κB, STAT3, p53 | Apoptosis in 40% of cells at 20µM | Anti-cancer, Anti-inflammatory |
| Resveratrol (Vitis vinifera) | HepG2 (Hepatocellular Carcinoma) | 10-100 µM | SIRT1, AMPK, Nrf2 | Cell Cycle Arrest (G1 phase) | Cardioprotection, Longevity |
| Artemisinin (Artemisia annua) | HEK293 (Kidney) & PBMCs | 1-10 µM | Ferroptosis, ROS Generation | Selective cytotoxicity in engineered lines | Anti-malarial, Anti-cancer |
| Withanolide D (Withania somnifera) | SH-SY5Y (Neuroblastoma) | 0.5-5 µM | HSF1-mediated Proteostasis, BDNF | Enhanced neurite outgrowth at 2µM | Neurodegenerative diseases |
Detailed Experimental Protocols
Protocol 1: 10x Genomics scRNA-seq for Plant Tissues (Protoplast-Based)
Aim: Generate single-cell transcriptomic profiles from plant tissues to study developmental trajectories or stress responses. Key Materials: Healthy plant tissue, Cellulase/Rhozyme enzyme solution, 10x Genomics Chromium Controller, Single Cell 3' Reagent Kits (v3.1), NucleoCounter, PCR thermal cycler, Bioanalyzer.
- Protoplast Isolation:
- Harvest 0.5g of target tissue (e.g., root tip, leaf mesophyll). Finely chop.
- Digest in 10ml enzyme solution (1.5% Cellulase R10, 0.4% Macerozyme R10, 0.4M mannitol, 10mM MES pH5.7, 10mM CaCl₂, 5mM β-mercaptoethanol) for 3-6 hours in the dark with gentle shaking (40 rpm).
- Filter through 40μm nylon mesh. Pellet protoplasts at 100 x g for 5 min.
- Wash twice with W5 solution (154mM NaCl, 125mM CaCl₂, 5mM KCl, 5mM glucose, 1.5mM MES pH5.7).
- Resuspend in 1ml of W5 solution. Count and assess viability (>80%) using NucleoCounter or Trypan Blue.
- Single-Cell GEM Generation & Library Prep:
- Adjust viable protoplast concentration to 700-1200 cells/μl.
- Load protoplast suspension onto a 10x Chromium Chip B with the Single Cell 3' GEM Reagent Kit. Aim for 10,000 cell recovery.
- Perform GEM-RT, cDNA amplification, and library construction per manufacturer's instructions. Use 12-14 cycles for cDNA amplification.
- Assess library quality (Bioanalyzer High Sensitivity DNA chip; expect peak ~450bp).
- Sequencing & Data Processing:
- Sequence on Illumina NovaSeq (Read1: 28 cycles, i7: 10 cycles, i5: 10 cycles, Read2: 90 cycles). Aim for ~50,000 reads/cell.
- Align reads to the respective plant reference genome (e.g., TAIR10 for Arabidopsis) using
Cell Ranger(10x Genomics) orSTARsolo. - Perform downstream analysis (clustering, trajectory inference, DEG analysis) in R using
SeuratorScanpyin Python.
Protocol 2: Screening Plant Compounds Using scRNA-seq in Human Cell Lines
Aim: Characterize heterogeneous transcriptional responses to plant-derived drug candidates. Key Materials: Human cell line (e.g., A549), plant compound (e.g., purified curcumin), DMSO vehicle control, 10x Genomics Chromium Controller, Single Cell 5' Reagent Kits (for potential V(D)J/CRISPR screening), Cell culture reagents.
- Cell Treatment & Preparation:
- Culture A549 cells in standard conditions. At ~70% confluency, treat with plant compound at IC20-IC50 (determined by prior viability assay) or vehicle control (DMSO, <0.1%) for 24 hours.
- Harvest cells using trypsin-EDTA. Quench with complete medium.
- Wash 2x with PBS + 0.04% BSA. Filter through a 40μm strainer. Count and adjust viability to >90%.
- Single-Cell Capture & Library Construction:
- Target 5,000 cells per condition (treated vs. control). Use the Chromium Controller and Single Cell 5' Reagent Kit.
- Follow the kit protocol for GEM generation, cDNA synthesis, and library construction. The 5' kit allows for simultaneous gene expression and surface protein (if using Feature Barcode technology) analysis.
- Data Integration & Analysis:
- Process data with
Cell Ranger. Integrate treated and control datasets using mutual nearest neighbors (e.g.,Seurat'sIntegrateDatafunction) to correct for batch effects. - Identify compound-responsive subpopulations via differential expression and pathway enrichment analysis (e.g., using
GSVAorAUCell). - Reconstruct altered cellular states or trajectories (e.g., cell cycle arrest, apoptosis initiation).
- Process data with
Visualizations
Plant Stress Response Signaling Pathway
scRNA-seq Workflow for Plant Tissues
Drug Discovery Pipeline with scRNA-seq
The Scientist's Toolkit: Research Reagent Solutions
| Item | Supplier/Example | Function in Protocol |
|---|---|---|
| Cellulase R10 | Yakult Pharmaceutical | Digest cellulose in plant cell walls for protoplast isolation. |
| Macerozyme R10 | Yakult Pharmaceutical | Digest pectin in plant cell walls for protoplast isolation. |
| Chromium Controller & Chip B | 10x Genomics | Microfluidic device to partition single cells into Gel Bead-in-Emulsions (GEMs). |
| Single Cell 3' Reagent Kit v3.1 | 10x Genomics | Contains all reagents (Gel Beads, enzymes, primers, buffers) for 3' gene expression library construction. |
| NucleoCounter NC-200 | ChemoMetec | Provides accurate cell count and viability assessment via fluorescence imaging. |
| DMSO (Cell Culture Grade) | Sigma-Aldrich | Vehicle for solubilizing hydrophobic plant compounds for in vitro treatment. |
| DMEM/F-12 Culture Medium | Gibco (Thermo Fisher) | Base medium for culturing human cell lines during compound screening. |
| Trypsin-EDTA (0.25%) | Gibco (Thermo Fisher) | Detaches adherent mammalian cells from culture flasks for harvesting. |
| High Sensitivity DNA Kit | Agilent Technologies | Assesses quality and fragment size of final scRNA-seq libraries prior to sequencing. |
| Illumina NovaSeq 6000 S4 Reagent Kit | Illumina | Provides chemistry for high-throughput sequencing of scRNA-seq libraries. |
Application Notes: Foundational Principles for Plant scRNA-seq
Single-cell RNA sequencing of plant tissues using the 10x Genomics platform presents unique challenges distinct from animal models. Successful outcomes are critically dependent on rigorous pre-protocol planning. The recalcitrant plant cell wall, diverse cell types with varying sizes, and high levels of secondary metabolites necessitate specialized workflows. This section outlines the core considerations for tissue selection, experimental design, and reagent preparation, contextualized within a thesis focused on optimizing 10x Genomics protocols for plant systems.
Tissue Selection Considerations: The choice of tissue directly impacts protoplasting efficiency and cell viability. Young, meristematic tissues (e.g., root tips, leaf mesophyll from young leaves) generally yield higher-quality protoplasts with less cell wall debris. Tissue must be processed rapidly post-harvest to minimize stress-induced transcriptional changes.
Experimental Design Imperatives: Proper replication and controls are non-negotiable. Biological replicates (tissues from independently grown plants) are essential to distinguish technical artifacts from biological variation. Including a positive control (e.g., a well-characterized cell line if available) and a negative control (ambient RNA or empty droplets) is crucial for quality assessment. Pilot experiments to determine optimal protoplasting duration and enzyme concentrations are strongly recommended before committing precious samples to a full 10x Genomics run.
Reagent Preparation Philosophy: All reagents, especially protoplasting enzymes and purification solutions, must be prepared fresh or from aliquots stored under optimal conditions. Osmolarity must be carefully adjusted to match the plant species and tissue type to prevent cell lysis or bursting. RNase-free practices are paramount from the moment of tissue harvest.
Protocols for Pre-Protocol Steps
Protocol 2.1: Systematic Tissue Evaluation and Selection
Objective: To empirically determine the most suitable tissue source for protoplast isolation for a given plant species.
Materials:
- Plant growth chambers with controlled conditions.
- Sterile dissection tools.
- Protoplasting enzyme solution (composition varies by species; common components: Cellulase R10, Macerozyme R10, Pectolyase, Driselase).
- W5 or CPW washing solution.
- Hemocytometer or automated cell counter.
- Fluorescence microscope with viability stain (e.g., Fluorescein diacetate, FDA).
- RNase-free tubes and pipettes.
Methodology:
- Grow Plants: Cultivate plants under standardized, reproducible conditions (light, temperature, humidity).
- Harvest Tissues: At the same time of day, aseptically harvest different tissue types (e.g., root tips, young leaves, stems, floral buds) from multiple biological replicate plants.
- Protoplast Isolation (Micro-scale): For each tissue type, process ~100 mg of tissue in 1 mL of optimized enzyme solution. Incubate with gentle agitation (40-60 rpm) for 3-4 hours.
- Purification: Filter the digest through a 40-70 µm cell strainer. Pellet protoplasts by centrifugation at 100-300 x g for 5 minutes.
- Quantification & Viability Assessment:
- Resuspend pellet in 1 mL of W5 solution.
- Count cells using a hemocytometer.
- Mix 10 µL of cell suspension with 1 µL of 0.01% FDA, incubate for 2 minutes, and count viable (fluorescent) vs. total cells under the microscope.
- Selection Criterion: Select the tissue yielding the highest viable cell concentration (cells/µL) and total viable cell yield per mg of starting material, with minimal debris.
Protocol 2.2: Pilot Experimental Design for Optimization
Objective: To establish key parameters for the full-scale 10x Genomics experiment.
Materials:
- Selected tissue from Protocol 2.1.
- Graded concentrations of protoplasting enzymes.
- Graded incubation times (1, 2, 3, 4 hours).
- RNase inhibitor.
- Equipment for cell counting and viability assessment.
Methodology:
- Set Up Factorial Matrix: Prepare a matrix of conditions varying two key factors: Enzyme Concentration (e.g., 0.5x, 1x, 1.5x of standard recipe) and Digestion Time (e.g., 2, 3, 4 hours).
- Run Parallel Digestions: For each condition in the matrix, perform a small-scale (e.g., 50 mg tissue) protoplasting reaction in triplicate.
- Assess Outputs: For each replicate, measure: (A) Total cell yield, (B) % Cell Viability, and (C) Cell Integrity (visual inspection for broken cells/debris).
- Analyze and Decide: Plot the data to identify the condition that maximizes both yield and viability. This condition is carried forward. The number of cells required for the 10x chip (e.g., ~10,000 target recoveries for a Chromium Next GEM Chip K) dictates the scale-up factor for the main experiment.
- Define Replication Strategy: Based on the thesis aims (discovery vs. differential expression), determine the number of biological replicates (typically 3-5 for robust statistics) and plan the sample multiplexing strategy using CellPlex or Antibody-based tags if applicable.
Protocol 2.3: Critical Reagent Preparation & QC
Objective: To ensure all reagents are optimized and RNase-free for plant single-cell workflows.
Materials (Partial List):
- RNaseZap or equivalent decontaminant.
- Diethyl pyrocarbonate (DEPC)-treated or ultrapure nuclease-free water.
- High-purity enzyme stocks.
- Salts for osmoticum (e.g., Mannitol, KCl, MgCl2, MES buffer).
- 0.4% Trypan Blue or AO/PI staining solution.
- BSA (RNase-free).
Methodology for Protoplasting Solution:
- Solution Preparation: In a dedicated RNase-free hood, prepare the protoplasting enzyme solution fresh.
- Osmolarity Adjustment: Dissolve osmoticum (e.g., 0.4-0.6 M mannitol) in DEPC-water. Adjust pH to 5.7-5.8. Filter sterilize (0.22 µm).
- Enzyme Addition: Weigh high-purity enzymes directly into the sterile osmoticum solution. Add CaCl2 (e.g., 10 mM) to stabilize membranes.
- Pre-incubation: Warm the solution to the digestion temperature (e.g., 28°C) for 10 minutes before adding tissue.
- Reagent QC: Test each new batch of enzyme solution with a small tissue sample and compare cell yield/viability to the previous batch. Document all lot numbers.
Data Presentation
Table 1: Quantitative Comparison of Tissue Types for Protoplast Isolation (Example Data from Arabidopsis thaliana)
| Tissue Type | Avg. Yield (Viable Cells/mg tissue) | Avg. Viability (%) | Avg. Protoplast Diameter (µm) | Notes |
|---|---|---|---|---|
| Root Tip (Meristematic) | 4,500 | 92 | 18-25 | High yield, uniform size, fast digestion. |
| Young Leaf Mesophyll | 3,200 | 88 | 25-40 | Good yield, slightly variable size. |
| Mature Leaf Mesophyll | 1,100 | 75 | 30-50 | Lower yield, more debris, longer digestion needed. |
| Hypocotyl | 850 | 65 | 15-60 | Very heterogeneous, low viability. |
| Floral Bud | 2,800 | 82 | 10-30 | Complex cell mixture, delicate handling required. |
Table 2: Pilot Experiment Matrix Results: Enzyme Concentration vs. Time
| Condition (Enzyme x Time) | Total Cell Yield (x10³) | Viability (%) | Recommended for 10x? |
|---|---|---|---|
| 0.5x Enzyme, 2 hrs | 45 | 95 | No (Yield too low) |
| 1.0x Enzyme, 2 hrs | 210 | 93 | Yes (Optimal) |
| 1.5x Enzyme, 2 hrs | 240 | 85 | Caution (Viability drop) |
| 0.5x Enzyme, 4 hrs | 95 | 90 | No |
| 1.0x Enzyme, 4 hrs | 250 | 88 | Yes (Alternative) |
| 1.5x Enzyme, 4 hrs | 260 | 70 | No (Poor viability) |
Visualizations
Pre-Protocol Planning Workflow for Plant scRNA-seq
Reagent Design Logic for Plant Protoplasting Solution
The Scientist's Toolkit: Research Reagent Solutions
Table 3: Essential Materials for Plant scRNA-seq Pre-Protocol Planning
| Reagent/Material | Function in Protocol | Critical Specification/Note |
|---|---|---|
| Cellulase R10 (or equivalent) | Degrades cellulose microfibrils in the primary cell wall. | Must be high-purity, low RNase activity. Lot variability is high; require QC. |
| Macerozyme R10 / Pectolyase | Degrades pectins in the middle lamella, dissociating cells. | Concentration is tissue-specific; optimal dose determined in pilot. |
| Osmoticum (e.g., D-Mannitol) | Maintains osmotic pressure to prevent protoplast lysis. | Concentration (0.4-0.8 M) is species and tissue dependent. |
| W5 or CPW Wash Solution | Washing and stabilizing protoplasts post-digestion. | Contains salts (KCl, CaCl₂) to maintain viability during handling. |
| RNase Inhibitor (e.g., Protector) | Inactivates endogenous RNases released during tissue disruption. | Add to all solutions post-autoclaving/filtration. Critical for RNA integrity. |
| Fluorescein Diacetate (FDA) | Cell-permeant viability stain; cleaved by esterases in live cells to fluorescent product. | Used for quick, microscopic viability assessment pre-10x. |
| 40-70 µm Cell Strainer | Removes undigested tissue and large debris from protoplast suspension. | Use nylon mesh, RNase-free. Size depends on target protoplast size. |
| Bovine Serum Albumin (BSA), RNase-free | Stabilizes protoplast membranes, reduces enzyme toxicity and adhesion. | Add to digestion and/or wash solutions (0.1-1.0%). |
Step-by-Step Optimized Protocol: From Live Plant Tissue to 10x Genomics Library
Application Notes
Successful single-cell RNA sequencing (scRNA-seq) of plant tissues using platforms like 10x Genomics hinges on the initial generation of a high-yield, high-viability, and transcriptionally unbiased protoplast suspension. This first stage is critical, as poor-quality input material cannot be remedied by downstream processing. The primary objectives are: 1) to select tissue with high cellular homogeneity and metabolic activity, 2) to pre-treat tissue to reduce stress and cell wall integrity, and 3) to optimize enzymatic digestion parameters for maximal viable protoplast release.
Current research underscores the need to balance protoplast yield with transcriptional fidelity. Mechanical and enzymatic stress can rapidly induce wound-response genes, potentially obscuring the native transcriptional state. Recent protocols emphasize rapid processing, cold-active enzymes, and the inclusion of transcriptional inhibitors like Actinomycin D during digestion to minimize stress artifacts.
Table 1: Impact of Pre-Treatment Conditions on Protoplast Yield and Viability
| Plant Species | Target Tissue | Optimal Pre-Culture Condition | Reported Yield (Protoplasts/g FW) | Viability (%) | Key Reference (Year) |
|---|---|---|---|---|---|
| Arabidopsis thaliana | Rosette Leaves | Dark incubation, 4°C, 16h | 2.5 - 5.0 x 10⁶ | 90-95 | (Shaw et al., 2021) |
| Oryza sativa (Rice) | Root Tips | Osmoticum incubation, 2h | 1.0 - 1.8 x 10⁶ | 85-90 | (Wang et al., 2022) |
| Nicotiana benthamiana | Young Leaves | Plasmolysis in CPW salts, 1h | 5.0 - 8.0 x 10⁶ | >90 | (Brenner et al., 2023) |
| Zea mays (Maize) | Seedling Mesocotyl | Enzymatic solution pre-vacuum infiltration | 3.0 x 10⁵ | 80-85 | (Satterlee et al., 2020) |
| Solanum lycopersicum (Tomato) | Fruit Pericarp | Pectolyase pre-soak, 30 min | 1.5 x 10⁶ | 75-80 | (Wang et al., 2023) |
Table 2: Common Enzymatic Digestion Mixtures for Plant Tissues
| Enzyme Component | Typical Concentration Range | Primary Function | Notes for scRNA-seq |
|---|---|---|---|
| Cellulase (e.g., Onozuka R-10) | 0.5% - 2.0% (w/v) | Degrades cellulose microfibrils | Purified isoforms reduce batch variability. |
| Macerozyme (e.g., R-10) | 0.1% - 0.5% (w/v) | Degrades pectins and middle lamella | Critical for tissue softening and cell separation. |
| Pectolyase | 0.01% - 0.05% (w/v) | Powerful pectin degradation | Use sparingly; can damage membranes. |
| Driselase | 0.1% - 0.5% (w/v) | Broad-spectrum; cellulase, hemicellulase, pectinase activity | Effective for recalcitrant tissues. |
| Osmoticum (Mannitol/Sorbitol) | 0.4 - 0.6 M | Maintains osmotic balance, prevents bursting | Must be optimized for each tissue type. |
| Buffer (MES, pH 5.7) | 20 mM | Maintains optimal enzyme activity |
Detailed Protocol
Protocol 1: Harvesting and Pre-Culture of Arabidopsis Rosette Leaves for scRNA-seq
Principle: A dark, cold pre-treatment reduces photosynthetic activity and metabolic stress, leading to more robust cell walls and higher subsequent protoplast viability.
Materials: Sterile forceps, Petri dishes, razor blades, growth chamber.
- Harvesting: Select 4-5 week-old plants. Excise entire, healthy rosette leaves at the base of the petiole using sterile forceps, avoiding major veins. Immediately place leaves in a 9 cm Petri dish on pre-chilled, wet filter paper.
- Pre-Treatment: Seal the Petri dish with Parafilm. Incubate in the dark at 4°C for 16 hours (overnight).
- Tissue Preparation: After incubation, briefly blot leaves dry on sterile paper towel. Using a sharp razor blade, slice leaves into 0.5-1 mm thin strips in a crosswise direction to increase surface area for enzyme penetration. Transfer strips to the enzymatic digestion solution.
Protocol 2: Enzymatic Digestion for Protoplast Release with Transcriptional Arrest
Principle: A controlled, gentle digestion in the presence of a transcriptional inhibitor minimizes the induction of stress-related genes.
Reagents: Protoplast digestion solution (see Table 2), WS wash solution (154 mM NaCl, 125 mM CaCl₂, 5 mM KCl, 2 mM MES, pH 5.7), Actinomycin D (5 µg/mL stock).
- Solution Preparation: Prepare digestion solution (e.g., 1.5% Cellulase R-10, 0.4% Macerozyme R-10, 0.4M Mannitol, 20 mM KCl, 20 mM MES pH 5.7, 10 mM CaCl₂, 0.1% BSA). Filter sterilize (0.22 µm). Pre-warm to room temperature.
- Digestion: Transfer pre-treated, sliced tissue to a 10 mL enzyme solution in a 10 cm Petri dish. Add Actinomycin D to a final concentration of 50 nM.
- Incubation: Digest in the dark at room temperature (22-25°C) with gentle shaking (40-50 rpm) for 2-3 hours. Monitor digestion visually every 30 minutes.
- Termination & Filtration: After tissue disintegration, gently swirl and pass the protoplast suspension through a 40 µm nylon cell strainer into a 50 mL tube to remove undigested debris.
- Washing: Gently layer the filtrate over 10 mL of WS solution. Centrifuge at 100 x g for 5 minutes at 4°C. Carefully aspirate the supernatant. Resuspend the pelleted protoplasts gently in 5 mL of fresh WS solution. Repeat wash once.
- Viability & Yield Assessment: Mix 10 µL of protoplast suspension with 10 µL of Fluorescein Diacetate (FDA) stain. Count viable (fluorescent) and total cells using a hemocytometer under a fluorescence microscope. Adjust concentration to target 1,000-1,200 cells/µL for 10x Genomics loading.
Visualizations
Diagram 1: Tissue harvesting to protoplast workflow.
Diagram 2: Stress response pathway inhibited during digestion.
The Scientist's Toolkit
Table 3: Essential Research Reagent Solutions for Plant Protoplast Isolation
| Reagent/Material | Function/Principle | Key Considerations for scRNA-seq |
|---|---|---|
| Cellulase Onozuka R-10 | Crude enzyme preparation for digesting cellulose. | Batch variability is high; pre-test for optimal concentration. Purified cellulases (e.g., Cellulase RS) offer more consistency. |
| Macerozyme Onozuka R-10 | Crude enzyme for degrading pectins in the middle lamella. | Essential for tissue maceration. Often used in combination with cellulase. |
| Osmoticum (Mannitol) | An inert sugar alcohol used to create a plasmolyzing solution. | Prevents protoplast lysis by balancing internal osmotic pressure. 0.4-0.6 M is typical. |
| CPW Salt Solution | A balanced salt solution (Cell and Protoplast Washing) used during digestion and washing. | Provides essential ions (K⁺, Ca²⁺, Mg²⁺) to maintain membrane stability. |
| Actinomycin D | A transcriptional inhibitor that blocks RNA elongation. | Added during digestion (50-100 nM) to "freeze" the transcriptional state and suppress stress-induced genes. |
| Fluorescein Diacetate (FDA) | Viability stain. Non-fluorescent FDA crosses membranes and is cleaved by esterases in live cells to fluorescent fluorescein. | Allows rapid assessment of protoplast viability and membrane integrity prior to scRNA-seq. |
| 40 µm Cell Strainer | Nylon mesh filter. | Removes undigested tissue clumps and large debris, generating a single-cell suspension crucial for microfluidic partitioning. |
Application Notes
Within the broader thesis on optimizing 10x Genomics scRNA-seq for complex plant tissues, Stage 2 enzymatic digestion is the critical determinant of viable protoplast yield and RNA integrity. The "perfect" cocktail is not universal but is a tissue- and species-specific formulation balancing digestion efficiency with cellular stress minimization. The primary goal is to hydrolyze the pectin-rich middle lamella and the complex polysaccharides of the primary cell wall (cellulose, hemicellulose) while preserving membrane integrity for downstream barcoding and sequencing.
Key challenges include the diversity of plant cell wall composition and the induction of defense-related stress genes upon cell wall degradation. Recent research emphasizes combinatorial testing and real-time viability assessment.
Table 1: Quantitative Comparison of Common Enzyme Components for Plant Protoplast Isolation
| Enzyme | Typical Working Concentration | Target Substrate | Key Considerations for scRNA-seq |
|---|---|---|---|
| Cellulase (e.g., Cellulase R-10) | 0.5% - 2.0% (w/v) | Cellulose (β-1,4-glucan) | Core enzyme; concentration scales with tissue lignification. High concentrations can induce stress. |
| Macerozyme (e.g., Macerozyme R-10) | 0.1% - 0.5% (w/v) | Pectin (in middle lamella) | Critical for cell separation; low pectinase activity reduces yield but may lower stress responses. |
| Pectolyase | 0.01% - 0.05% (w/v) | Pectin (polygalacturonic acid) | Highly potent; use minimal doses for tough tissues. Can rapidly compromise viability if overused. |
| Hemicellulase (e.g., Hemicellulase H2125) | 0.1% - 0.5% (w/v) | Hemicelluloses (e.g., xyloglucan) | Beneficial for grasses and secondary walls; improves digestion kinetics in complex mixtures. |
| Driselase | 0.5% - 1.5% (w/v) | Broad-spectrum (Cellulose, Hemicellulose) | Powerful but variable lot-to-lot; requires pre-testing for viability impact. |
Table 2: Optimization Variables & Measured Outcomes
| Variable | Test Range | Optimal Outcome for 10x | Measurement Method |
|---|---|---|---|
| Incubation Time | 1 - 6 hours | Minimal time for >70% yield | Protoplast count over time (hemocytometer) |
| Osmoticum (Mannitol) | 0.4 - 0.8 M | 0.5 - 0.6 M for most tissues | Protoplast diameter stability, bursting rate |
| pH of Enzyme Solution | 5.5 - 5.8 | pH 5.7 | Enzyme activity optimization, viability |
| Temperature | 22°C - 28°C | 23°C - 25°C (low stress) | RNA quality post-digestion (Bioanalyzer) |
| Gentle Agitation | 30-60 rpm (orbital) | 40 rpm | Yield vs. debris generation |
Experimental Protocols
Protocol 1: Tissue-Specific Cocktail Formulation Screen
Objective: To empirically determine the optimal enzyme combination and incubation time for a novel plant tissue.
Reagents:
- Enzyme stocks (2% w/v in 0.6M mannitol, filter-sterilized)
- Protoplast Washing Solution (PWS): 0.6M mannitol, 10mM MES pH 5.7, 5mM KCl, 5mM CaCl₂
- Fluorescein Diacetate (FDA) viability stain (0.01% w/v in acetone)
- Evans Blue stain (0.05% w/v)
Methodology:
- Prepare four 10 mL digestion cocktails in deep 6-well plates:
- Cocktail A: 1.5% Cellulase R-10, 0.3% Macerozyme R-10.
- Cocktail B: 1.5% Cellulase R-10, 0.3% Macerozyme R-10, 0.02% Pectolyase.
- Cocktail C: 1% Cellulase R-10, 0.2% Macerozyme R-10, 0.5% Hemicellulase.
- Cocktail D: 1% Driselase, 0.1% Macerozyme R-10.
- Finely slice 500 mg of surface-sterilized plant tissue into 0.5-1 mm strips. Distribute evenly across wells.
- Incubate in the dark at 24°C with gentle orbital shaking at 40 rpm.
- Time-Point Sampling (every 60 min for 5 hrs): a. Gently pipette 100 µL of digestion mixture. b. Add 10 µL FDA, incubate 2 min, then add 10 µL Evans Blue. c. Count total, FDA-positive (viable), and Evans Blue-positive (non-viable) protoplasts on a hemocytometer. d. Plot viable yield (protoplasts/g tissue) vs. time for each cocktail.
- Selection Criteria: Choose the cocktail and time point yielding >70% viability and sufficient yield for 10x (>10⁵ protoplasts per reaction) before yield plateaus.
Protocol 2: Post-Digestion Viability Assessment & Cleanup for 10x
Objective: To purify and assess protoplasts for immediate input into the 10x Chromium controller.
Reagents:
- 40 µm Flowmi cell strainers
- Protoplast Wash Solution (PWS, ice-cold)
- Percoll gradient solution (prepared in PWS)
- RNAse inhibitor
Methodology:
- After optimal digestion, gently pass the mixture through a 40 µm strainer into a 50 mL tube to remove undigested debris.
- Rinse the digestion plate with 5 mL ice-cold PWS and pass through the strainer.
- Pellet protoplasts at 100 x g for 5 min at 4°C. Decant supernatant carefully.
- Optional Gradient Purification: Resuspend pellet in 2 mL PWS. Layer gently over a 5 mL 10%-50% Percoll step gradient. Centrifuge at 200 x g for 10 min (no brake). Collect the intact protoplast band at the interface.
- Wash pelleted/protocol protoplasts twice with 10 mL ice-cold PWS.
- Resuspend final pellet in 1 mL PWS + 0.04 U/µL RNAse inhibitor.
- Perform final count and viability assessment using an automated cell counter or FDA/Evans Blue.
- Adjust concentration to the target for 10x (e.g., 1,000 cells/µL) and keep on ice until loading (<30 min).
Visualizations
Workflow for Enzyme Cocktail Optimization & Protoplast Isolation
Enzymatic Digestion Triggers Stress Signaling Pathways
The Scientist's Toolkit: Research Reagent Solutions
| Item | Function in Protocol | Critical Consideration for 10x scRNA-seq |
|---|---|---|
| Cellulase R-10 | Hydrolyzes cellulose microfibrils in the primary cell wall. | Standardized, low RNase activity. Batch variability exists; test new lots. |
| Macerozyme R-10 | Degrades pectin in the middle lamella, enabling cell separation. | Contains various pectinases. Lower activity than pectolyase, gentler. |
| Pectolyase Y-23 | Potent pectinase for recalcitrant tissues. | Use at very low concentrations to avoid rapid loss of viability. |
| Osmoticum (Mannitol) | Maintains osmotic pressure to prevent protoplast bursting. | Concentration is tissue-specific. Must be kept iso-osmotic throughout. |
| Protoplast Wash Solution (PWS) | Provides ionic and osmotic stability post-digestion. | Ca²⁺ helps stabilize membranes. Must be ice-cold to slow metabolism. |
| Percoll | Silica nanoparticle gradient for purifying viable protoplasts. | Removes debris and dead cells, improving 10x GEM capture efficiency. |
| Fluorescein Diacetate (FDA) | Cell-permeant viability stain (cleaved to fluorescent fluorescein). | Quick assessment; viable protoplasts show green fluorescence. |
| RNAse Inhibitor | Added to final resuspension buffer to protect RNA integrity. | Essential for preserving mRNA quality during final handling steps. |
This section details the critical third stage of a workflow for generating high-quality single-cell suspensions from plant tissues for 10x Genomics Chromium single-cell RNA sequencing (scRNA-seq). Protoplasts, plant cells devoid of cell walls, are the target population. The success of this stage directly determines library complexity, data quality, and the biological validity of downstream analyses. This protocol is optimized for model systems like Arabidopsis thaliana seedlings and tobacco (Nicotiana benthamiana) leaves but is adaptable with empirical optimization.
Key Research Reagent Solutions
| Reagent / Material | Primary Function | Key Considerations for scRNA-seq |
|---|---|---|
| Macerozyme R-10 | Pectolyase; degrades pectin in middle lamella, initiating tissue dissociation. | Batch variability is high. Must be activity-tested; excessive digestion reduces viability. |
| Cellulase R-10 | Cellulase; hydrolyzes cellulose in the primary cell wall, releasing protoplasts. | Often used in combination with Macerozyme. Purified grades (e.g., "Yakult") reduce toxicity. |
| D-Mannitol (0.4-0.6 M) | Osmoticum. Maintains protoplast tonicity, prevents lysis, and stabilizes membrane. | Concentration is tissue-specific. Replaces salts to avoid triggering defense responses. |
| MES Buffer (pH 5.7) | Maintains optimal enzymatic activity during digestion. | |
| BSA (0.1% w/v) | Added to enzyme solution to stabilize enzymes and protect protoplast membranes. | Fatty-acid-free is preferred. |
| Calcium Chloride (10 mM) | Stabilizes plasma membranes and maintains viability post-isolation. | |
| Percoll or Sucrose Gradient | Medium for density-based purification of intact protoplasts from debris. | Removes broken cells and organelles, critical for clean barcoding in 10x GEMs. |
| FDA (Fluorescein Diacetate) / PI (Propidium Iodide) | Viability staining. FDA stains live cells (esterase activity), PI stains dead cells (membrane integrity). | Vital for assessing sample quality pre-loading onto Chromium chip. |
| W5 Solution | A low-salt, calcium-containing wash and storage solution. Maintains protoplast viability for hours. | Typically: 154 mM NaCl, 125 mM CaCl₂, 5 mM KCl, 5 mM glucose, pH 5.7. |
| Cell Strainer (40 µm, then 20 µm) | Sequential filtration to remove undigested tissue and cell aggregates. | Critical step to ensure a single-cell suspension for 10x Genomics. |
Detailed Protocol: Protoplast Isolation & Purification
A. Tissue Digestion & Protoplast Release
- Enzyme Solution Preparation (10 mL, for leaf tissue):
- 1.5% (w/v) Cellulase R-10
- 0.4% (w/v) Macerozyme R-10
- 0.4 M D-Mannitol
- 10 mM MES-KOH, pH 5.7
- 10 mM CaCl₂
- 0.1% (w/v) BSA
- Filter-sterilize (0.22 µm). Pre-warm to 28°C.
Digestion:
- Finely slice pre-washed, sterilized leaf tissue (or use etiolated seedlings) with a sharp razor blade in a drop of enzyme solution.
- Transfer tissue to a Petri dish containing the remaining enzyme solution.
- Incubate in the dark for 3-4 hours at 28°C with gentle shaking (30-40 rpm).
Initial Release:
- Gently swirl the dish and pipette the solution up and down with a wide-bore pipette tip to release protoplasts.
- Pass the suspension through a 40 µm nylon mesh cell strainer into a 50 mL tube to remove large debris.
B. Purification via Density Gradient Centrifugation
- Gradient Preparation: Underlay the filtered protoplast suspension with an equal volume of a sterile W5 solution containing 0.5 M sucrose and 10 mM CaCl₂.
- Centrifugation: Centrifuge at 100 x g for 10 minutes at 4°C, with low brake.
- Collection: Intact, viable protoplasts will form a green band at the interface between the enzyme/mannitol layer and the sucrose layer. Carefully collect this band with a Pasteur pipette.
- Washing: Transfer protoplasts to a new tube. Add 10 mL of ice-cold W5 solution, gently invert to mix. Centrifuge at 100 x g for 5 minutes at 4°C. Aspirate supernatant.
- Resuspension & Filtration: Gently resuspend the pellet in 1-5 mL of fresh W5 or desired buffer (e.g., PBS with 0.04% BSA). Pass through a 20 µm cell strainer. Keep on ice.
Viability Assessment Protocol
Dual FDA/PI Staining:
- Prepare staining solution: Add FDA stock (5 mg/mL in acetone) and PI stock (1 mg/mL in water) to a protoplast aliquot for final concentrations of 10 µg/mL FDA and 5 µg/mL PI.
- Incubate at room temperature in the dark for 5-10 minutes.
- Place a 10 µL drop on a hemocytometer.
- Imaging & Counting: Use a fluorescence microscope with FITC (488 nm ex./530 nm em.) and TRITC (540 nm ex./610 nm em.) filters.
- Viable: Green cytoplasmic fluorescence (FDA hydrolyzed).
- Non-Viable: Red nuclear fluorescence (PI enters compromised membranes).
- Double-stained cells (green & red) are considered non-viable.
- Count at least 200 cells across multiple fields. Calculate viability:
% Viability = (Number of FDA+ only cells) / (Total cells counted) * 100
| Parameter | Target Range for 10x scRNA-seq | Typical Yield & Notes |
|---|---|---|
| Final Protoplast Viability | >85% (Minimum: 80%) | 85-95% with optimized protocol. Lower viability increases ambient RNA. |
| Protoplast Concentration | 700-1,200 cells/µL (for 10x loading) | Varies by tissue: Arabidopsis leaf: 1-2 x 10⁶ protoplasts/g tissue. |
| Aggregate Rate | <5% | Critical post-20µm filtration. Assess via microscopy. |
| Intact Cell Yield | N/A | Expect 30-70% recovery from initial tissue mass after purification. |
| Recommended Load Volume | ~40 µL | According to 10x Genomics "Targeted Cell Recovery" guide for Chromium Next GEM. |
Experimental Workflow & Signaling Context
Diagram Title: Protoplast Isolation to QC Workflow for scRNA-seq
Diagram Title: Enzymatic Digestion Triggers and scRNA-seq Quality Risks
Within the context of developing a robust 10x Genomics single-cell RNA sequencing (scRNA-seq) protocol for plant tissues, Stage 4 is a critical technical juncture. Successful barcoding on the Chromium Chip is contingent upon loading a precise concentration of viable, single-cell suspensions. This stage addresses the unique challenges posed by plant protoplasts or nuclei—such as fragility, size heterogeneity, and residual debris—by standardizing the cell concentration to ensure optimal capture efficiency and library diversity. Failure to accurately normalize and load the sample can lead to data artifacts, including multiplets or low gene detection rates, compromising downstream biological insights relevant to agricultural and pharmaceutical development.
Application Notes
Accurate cell concentration normalization is paramount for the 10x Genomics Chromium system, which is optimized for a specific loading range. Deviations can significantly impact data quality and cost-efficiency.
Table 1: Impact of Loaded Cell Concentration on 10x Genomics scRNA-seq Outcomes
| Loaded Cell Concentration | Expected Recovery Rate | Risk of Multiplets | Recommended Use Case |
|---|---|---|---|
| Below Target Range (< 700 cells/µL) | Low capture efficiency, wasted reagents | Very Low | Pilot studies with limited sample |
| Optimal Range (700-1,200 cells/µL) | High, aligns with system specification (e.g., ~65% for v3.1) | Optimal (<10%) | Standard high-quality experiments |
| Above Target Range (> 1,200 cells/µL) | Saturated, potential for decreased recovery | High (>10%) | Not recommended; wastes cells and increases costs |
Table 2: Key Parameters for Plant Cell/Nuclei Suspension Normalization
| Parameter | Target Value | Measurement Instrument | Rationale |
|---|---|---|---|
| Viability | >80% (protoplasts); >70% (nuclei) | Fluorescent dye (e.g., AO/PI) via hemocytometer or automated counter | Ensures high-quality RNA from intact cells/nuclei |
| Cell Concentration | 1,000-1,200 cells/µL (for target load) | Hemocytometer or automated cell counter | Accounts for expected recovery; targets 10,000 cells loaded for ~6,500 recovered |
| Aggregation/Debris | Minimal (clumps <5%) | Microscopic inspection | Prevents chip clogging and barcoding of cell clumps |
| Suspension Buffer | Isotonic, nuclease-inhibited (e.g., PBS + BSA + RNase inhibitor) | -- | Maintains integrity of fragile plant protoplasts or nuclei |
Experimental Protocols
Protocol 4.1: Final Concentration Normalization for Plant Protoplasts/Nuclei
Objective: To adjust the purified single-cell/nuclei suspension to the target concentration of 1,000-1,200 viable particles per microliter in a buffer compatible with the 10x Genomics Chromium Chip.
Materials:
- Purified single protoplast or nuclei suspension.
- Counting buffer: 1x PBS, 0.04% BSA, 0.2 U/µL RNase inhibitor.
- Viability stain: 0.4% Trypan Blue or Acridine Orange/Propidium Iodide (AO/PI).
- Hemocytometer (e.g., Neubauer chamber) or automated cell counter (e.g., Countess II, Bio-Rad).
- Microcentrifuge tubes and low-binding pipette tips.
- Centrifuge with swinging-bucket rotor suitable for low-speed, gentle pelleting.
Procedure:
- Prepare Working Suspension: Gently mix the purified cell/nuclei suspension. Take a 10 µL aliquot and mix with 10 µL of viability stain.
- Determine Viability & Concentration: Load 10 µL of the stained mixture onto a hemocytometer. Count viable and non-viable particles in at least the four corner quadrants. For automated counters, use the appropriate cassette and settings for protoplasts or nuclei.
- Calculation: Viable cells/µL = (Total viable cells counted / Number of squares) x Dilution Factor x 10^4.
- Calculate Dilution/Centrifugation Requirements: Based on the count, calculate the volume of suspension needed to achieve the target concentration (e.g., 1,100 cells/µL) for the desired number of cells to load (typically targeting 10,000 cells). Account for expected losses during pipetting.
- Concentrate or Dilute:
- If concentration is too low: Centrifuge the required volume at 200-300 rcf (for protoplasts) or 500 rcf (for nuclei) for 5 minutes at 4°C. Gently aspirate supernatant and resuspend the pellet in a calculated, smaller volume of fresh counting buffer.
- If concentration is too high: Dilute the suspension with fresh counting buffer to the target concentration.
- Final Verification: Re-count the viability and concentration of the normalized suspension immediately before loading onto the chip.
Protocol 4.2: Loading onto the 10x Genomics Chromium Chip
Objective: To accurately combine the normalized cell suspension with master mix and partition them with gel beads in the Chromium Chip.
Materials:
- Normalized cell/nuclei suspension (from Protocol 4.1).
- 10x Genomics Chromium Chip B (or model appropriate to kit).
- 10x Genomics Single Cell 3' GEM, Library & Gel Bead Kit v3.1 (or current version).
- RNase-free, low-retention recovery tubes.
- Single-cell compatible pipettes and tips (10 µL, 200 µL).
- Chromium Controller.
Procedure:
- Thaw and Prepare Reagents: Thaw the RT Reagent, Gel Beads, and Partitioning Oil on ice. Briefly centrifuge all tubes to bring contents to the bottom. Keep Gel Beads protected from light.
- Prepare Master Mix: On ice, prepare the Master Mix in a recovery tube according to the kit specifications. For example: x µL of RT Reagent, y µL of 10x Additive A, etc. Mix by pipetting gently.
- Combine Cells with Master Mix: Add the normalized cell suspension to the Master Mix. Mix by pipetting gently 10 times. Avoid introducing bubbles.
- Load the Chromium Chip: a. Place the Chromium Chip into the appropriate holder. b. Pipette the Partitioning Oil into the well marked 'OIL' until the meniscus disappears (approx. 215 µL for Chip B). c. Pipette the Gel Beads into the well marked 'GEL BEADS' (approx. 135 µL). d. Crucially, pipette the cell + Master Mix solution into the well marked 'CELLS' (approx. 100 µL). Use a fresh tip and ensure no air bubbles are introduced at the tip when dispensing.
- Run the Chip: Immediately place the loaded chip into the Chromium Controller and run the appropriate program (e.g., "Single Cell 3' v3").
- Post-Run Collection: After the run, carefully collect the generated GEMs (Gel Bead-in-Emulsions) from the recovery port into a prepared recovery tube. Proceed immediately to reverse transcription.
Visualization
Title: Cell Concentration Normalization & Loading Workflow
Title: Chromium Chip Loading Schematic
The Scientist's Toolkit
Table 3: Essential Research Reagents & Materials for Stage 4
| Item | Function in Protocol | Key Consideration for Plant Samples |
|---|---|---|
| Hemocytometer / Automated Cell Counter | Accurately determine cell concentration and viability. | For protoplasts, manual counting may be preferred due to size/clumping. Automated counters require size calibration for nuclei. |
| Viability Stain (AO/PI or Trypan Blue) | Distinguish viable from non-viable cells/nuclei. | AO/PI is more reliable for nuclei. Protoplasts may be sensitive to Trypan Blue; incubation time should be minimized. |
| Low-Binding Microcentrifuge Tubes & Tips | Minimize adhesion and loss of cells/nuclei to plastic surfaces. | Critical for maintaining accurate concentration after normalization. |
| RNase Inhibitor | Added to all suspension buffers to prevent RNA degradation. | Essential for nuclei suspensions due to exposed RNA. |
| Bovine Serum Albumin (BSA), Ultra-Pure | Reduces adhesion and cushions fragile protoplasts/nuclei in buffer. | Use at 0.01-0.1% in PBS or appropriate osmoticum. |
| Chromium Chip & Controller | Generates nanoliter-scale GEMs for barcoding. | Chip B is standard for most cell types. Ensure controller is calibrated. |
| Single Cell 3' GEM Kit (v3.1/v4) | Provides all chemistries for GEM generation, RT, and library prep. | v3.1 is widely validated. Check for nucleus-specific protocols if using isolated nuclei. |
| Partitioning Oil | Creates immiscible barrier for forming stable droplets (GEMs). | Must be fresh and from the kit; old oil can lead to poor droplet generation. |
Application Notes
This protocol details the critical adjustments required for successful single-cell RNA sequencing of plant tissues using 10x Genomics technology. Plant cells present unique challenges, primarily due to the presence of a rigid cell wall, high autofluorescence, and abundant secondary metabolites. The core adaptation involves the generation of high-quality protoplasts prior to loading onto the Chromium controller. Success hinges on optimizing enzymatic digestion to maximize viable, intact protoplast yield while minimizing stress responses that can alter transcriptional profiles.
Recent studies (2023-2024) emphasize that the choice of cell wall digesting enzymes, osmoticum, and digestion duration must be empirically determined for each tissue type. Furthermore, protoplasts are fragile; therefore, all subsequent steps—washing, filtering, and resuspension—must be performed with gentle handling. The following tables summarize key quantitative benchmarks and reagent adjustments.
Table 1: Protoplast Viability and Yield Benchmarks for Major Tissue Types
| Tissue Type | Target Viability (Live/Dead Stain) | Target Yield (Protoplasts per gram FW) | Recommended Digestion Time (hrs) | Critical Osmoticum |
|---|---|---|---|---|
| Arabidopsis Leaf | >85% | 1.0 - 2.5 x 10⁶ | 2-3 | 0.4-0.5 M Mannitol |
| Root (Primary) | >80% | 0.5 - 1.5 x 10⁶ | 3-4 | 0.5 M Mannitol |
| Cell Suspension Culture | >90% | 5.0 - 10.0 x 10⁶ | 1-2 | 0.4 M Sucrose |
| Shoot Apical Meristem | >70% | 0.1 - 0.5 x 10⁶ | 4-6 | 0.6 M Mannitol |
Table 2: 10x Genomics Reaction Adjustments for Plant Protoplasts
| Standard 10x Component | Typical Animal Cell Adjustment | Plant-Specific Adjustment | Rationale |
|---|---|---|---|
| Input Cell Concentration | 700-1,200 cells/µL | 800-1,500 cells/µL | Compensates for larger cell size and potential clumping. |
| RT Reaction Time | 45 min | 60-90 min | Higher RNA complexity and potential for PCR inhibitors. |
| GEM Recovery Bias | Minimal | Size-based bias towards smaller protoplasts. | Larger protoplasts may be underrepresented in GEMs. |
| cDNA Amplification Cycles | 12 cycles | 13-15 cycles | Lower mRNA capture efficiency per protoplast. |
Experimental Protocols
Protocol 1: Optimized Protoplast Isolation for 10x Genomics
Materials: See "Scientist's Toolkit" below. Procedure:
- Tissue Harvest & Plasmolysis: Finely chop 0.5-1g of fresh tissue in a Petri dish containing 10 mL of pre-chilled, filter-sterilized CPW solution with 13% mannitol (CPW13M). Incubate on ice for 30 min.
- Enzymatic Digestion: Replace CPW13M with 10 mL of enzyme solution (1.5% Cellulase R10, 0.4% Macerozyme R10, 0.4 M mannitol, 10 mM MES pH 5.7, 1 mM CaCl₂, 0.1% BSA, 5 mM β-mercaptoethanol). Vacuum infiltrate for 15 min. Incubate in the dark at 25°C with gentle shaking (40 rpm) for 2-4 hours (see Table 1).
- Protoplast Release & Filtration: Gently swirl the digestion mix and pass it through a 70 µm Nylon cell strainer into a 50 mL tube. Rinse the plate with 10 mL of W5 solution (154 mM NaCl, 125 mM CaCl₂, 5 mM KCl, 2 mM MES pH 5.7) and pass through the strainer.
- Purification: Centrifuge filtrate at 100 x g for 5 min at 4°C. Carefully aspirate supernatant. Gently resuspend pellet in 10 mL ice-cold W5 solution. Centrifuge again. Repeat wash.
- Viability Assessment & Counting: Resuspend final pellet in 1 mL of 0.4 M mannitol. Mix 10 µL protoplasts with 10 µL Trypan Blue or Fluorescein Diacetate (FDA). Count and assess viability using a hemocytometer. Target viability >80%.
- Preparation for 10x: Centrifuge and resuspend protoplasts at 1000-1500 cells/µL in the recommended 0.4 M mannitol-based resuspension buffer. Keep on ice until loading (<30 min).
Protocol 2: Adjusted GEM Generation & cDNA Synthesis for Plant Protoplasts
Note: Follow 10x Genomics Chromium Next GEM Single Cell 3' Reagent Kits v3.1 or v4 user guide with the following modifications. Procedure:
- Cell Load Calculation: Calculate required volume of cell suspension based on a target recovery of 5,000-10,000 GEMs. Increase target cell input by 20% compared to animal cells to account for potential loss.
- GEM Generation: Perform on Chromium Controller per standard protocol. No hardware modifications required.
- Reverse Transcription (cDNA Synthesis):
- After GEM generation, perform the RT reaction in a thermocycler with the following adjusted profile: 53°C for 60 minutes (increased from 45 min), followed by 85°C for 5 minutes, then hold at 4°C.
- Add 1 µL of RNase inhibitor per 100 µL RT reaction as an extra precaution.
- cDNA Clean-up & Amplification:
- Recover cDNA per standard protocol using DynaBeads.
- Perform cDNA amplification with 14 cycles as a starting point. Analyze 1 µL on a Bioanalyzer High Sensitivity DNA chip. Optimal cDNA profile should show a broad smear from 0.5-10 kb.
- Library Construction: Proceed with fragmentation, end-repair, A-tailing, adaptor ligation, and sample index PCR as per the standard 10x protocol. Validate libraries via Bioanalyzer.
Diagrams
The Scientist's Toolkit
| Research Reagent Solution | Function in Plant scRNA-seq Protocol |
|---|---|
| Cellulase R10 & Macerozyme R10 | Enzyme cocktail for digesting plant cell walls to release protoplasts. Critical for tissue-specific optimization. |
| Mannitol (0.4-0.6 M) | Osmoticum used in digestion and resuspension buffers to maintain protoplast integrity and prevent lysis. |
| CPW Salt Solution | Cell and Protoplast Washing salts, provides ionic balance during plasmolysis and washing steps. |
| W5 Solution | Washing solution with high calcium, stabilizes protoplast membranes post-digestion. |
| Fluorescein Diacetate (FDA) | Viability stain. Live protoplasts convert non-fluorescent FDA to fluorescent fluorescein. |
| RNase Inhibitor (e.g., Protector) | Added to RT reaction to counteract potential RNase activity from plant metabolites. |
| DynaBeads MyOne SILANE | Magnetic beads used for post-RT clean-up to recover cDNA from the GEM emulsion. |
| Chromium Next GEM 3' Kit v3.1/v4 | Core 10x Genomics reagents containing Gel Beads, Partitioning Oil, Master Mix, and Enzymes. |
| 0.4 M Mannitol Resuspension Buffer | Final buffer for protoplasts prior to loading; maintains isotonic conditions compatible with 10x Master Mix. |
| Nylon Mesh Filters (40µm, 70µm) | For sequential filtration to remove undigested tissue and cell clumps, ensuring single-cell suspension. |
Within the broader thesis on developing robust 10x Genomics single-cell RNA sequencing (scRNA-seq) protocols for complex plant tissues, Stage 6 represents the critical juncture where barcoded single-cell or single-nucleus suspensions are converted into sequencer-ready libraries. Plant samples pose unique challenges due to contaminants like polysaccharides, phenolics, and secondary metabolites, which can inhibit enzymatic reactions. This stage ensures the generation of high-quality cDNA libraries with stringent quality control (QC) to guarantee data integrity for downstream bioinformatics analysis.
Key Challenges in Plant Library Construction
- Inhibitor Carryover: Residual cellular debris from incomplete lysis can co-precipitate with nucleic acids.
- Lower cDNA Yield: Due to the inherent difficulty in extracting intact nuclei/RNA from rigid cell walls.
- Ambient RNA: Protoplasting steps can release cytoplasmic RNA, which may be absorbed by other nuclei, leading to background noise.
Detailed Protocol: Library Construction from Plant Nuclei
A. cDNA Amplification & Cleanup
- Post-GEM-RT Cleanup: Following Reverse Transcription within Gel Bead-in-Emulsion (GEMs), use the provided Silane magnetic beads to recover cDNA. Perform two separate 80% ethanol washes to remove plant-derived enzymatic inhibitors thoroughly.
- cDNA Amplification:
- Use the recommended 10x Genomics primer and PCR enzyme mix.
- Cycling Conditions: 98°C for 3 min; [98°C for 15 sec, 67°C for 20 sec, 72°C for 1 min] for 12-14 cycles (optimized for plant nuclei, typically lower than animal cells); 72°C for 1 min; hold at 4°C.
- Note: Cycle number must be empirically determined using a qPCR side reaction to prevent over-amplification.
- SPRIselect Cleanup: Purify amplified cDNA using SPRIselect beads at a 0.6x ratio to remove fragments <500 bp, including primer dimers and small contaminants.
B. Library Construction (Fragmentation, End-Repair, A-tailing, and Adaptor Ligation)
- Fragmentation & Size Selection: Fragment the purified cDNA to a target size of ~300-400 bp using the provided enzyme blend. Perform a double-sided SPRI selection (e.g., 0.45x followed by 0.8x ratios) to isolate the optimal size distribution.
- End-prep and A-tailing: Perform end-repair and add an 'A' base to the 3' ends using the master mix provided in the 10x kit, following standard incubation times.
- Adaptor Ligation: Ligate sample index adaptors (SI) and R1 primer sequence. Use a 1.2x SPRIselect bead cleanup to maximize recovery of ligated product.
C. Sample Indexing PCR & Final Cleanup
- Indexing PCR:
- Use the recommended polymerase and P5 primer with a unique sample index (SI) primer for each library.
- Cycling Conditions: 98°C for 45 sec; [98°C for 20 sec, 54°C for 30 sec, 72°C for 20 sec] for 12-14 cycles; 72°C for 1 min.
- Final Purification: Clean up the final library using a 0.8x SPRIselect bead ratio. Elute in Buffer EB (10 mM Tris-HCl, pH 8.5) to ensure compatibility with sequencing platforms.
Quality Control Metrics and Interpretation
Rigorous QC at each step is non-negotiable for plant-derived libraries.
Table 1: Essential QC Metrics for Plant scRNA-seq Libraries
| QC Stage | Metric | Recommended Tool/Instrument | Optimal Value for Plant Samples | Interpretation & Action |
|---|---|---|---|---|
| Post-cDNA Amplification | cDNA Yield | Fluorometer (Qubit) | > 2.5 ng/μL (from ~10k nuclei) | Low yield indicates poor GEM-RT efficiency; optimize nuclei prep. |
| cDNA Size Profile | Bioanalyzer/TapeStation | Smear centered ~1500-2000 bp | Shift to lower sizes suggests degradation or over-fragmentation. | |
| Post-Library Construction | Library Concentration | qPCR (Kapa/SYBR) | ≥ 2 nM | Critical for accurate sequencing loading. Fluorometer values overestimate. |
| Library Size Distribution | Bioanalyzer/TapeStation | Peak ~350-450 bp | Confirms successful fragmentation and adapter ligation. | |
| Molarity for Sequencing | qPCR (Kapa/SYBR) | 700-1500 pM (NovaSeq) | Enables accurate pooling and cluster density optimization. |
Table 2: Troubleshooting Common Plant Library Issues
| Problem | Potential Cause | Solution |
|---|---|---|
| Low cDNA Yield | PCR inhibitors present in sample. | Increase Silane bead wash steps; include an additional ethanol precipitation pre-cleanup. |
| High Background in Size Profile (<300 bp) | Excess free adaptors or primer dimers. | Optimize SPRI bead ratios; perform a double-sided size selection. |
| Low Sequencing Diversity | Over-amplification during cDNA or Index PCR. | Reduce cycle number based on qPCR side reaction (aim for Cq < 12). |
The Scientist's Toolkit: Key Reagents & Materials
| Item | Function in Protocol | Critical Consideration for Plant Samples |
|---|---|---|
| 10x Genomics Chromium Next GEM Single Cell 3’ Kit v3.1 | Core reagents for GEM generation, barcoding, RT, and library prep. | Standard kit works; success hinges on preceding high-quality nuclei isolation. |
| SPRIselect / AMPure XP Beads | Size-selective purification and cleanup of cDNA/library fragments. | Accurate bead:nucleic acid ratio is vital to recover optimally sized fragments. |
| High Sensitivity DNA Assay Kit (Qubit/Bioanalyzer) | Accurate quantification and sizing of cDNA and final libraries. | Essential for determining optimal loading concentrations, as plant inhibitors can skew UV absorbance. |
| Kapa Library Quantification Kit (qPCR) | Accurate quantification of amplifiable library fragments for sequencing. | The gold standard; prevents over/under-loading the sequencer. |
| Buffer EB (10 mM Tris-HCl, pH 8.5) | Elution buffer for final library. | Low EDTA concentration prevents interference with sequencing chemistry. |
| Fresh 80% Ethanol | Wash solution for magnetic bead cleanups. | Must be freshly prepared to ensure effective removal of salts and contaminants. |
Visualizations
Title: Plant scRNA-seq Library Construction and QC Workflow
Title: Stage 6 Dependencies in the Overall Thesis Workflow
Within the broader thesis investigating the optimization of 10x Genomics single-cell RNA sequencing (scRNA-seq) for complex plant tissues, the sequencing phase is critical. This stage dictates data quality, cost-efficiency, and the ability to multiplex samples. Proper configuration of sequencing depth, read length, and multiplexing strategy is essential to capture the transcriptional diversity of plant cells, overcome challenges like high transcriptome complexity and high secondary metabolite content, and enable robust downstream analysis.
Core Sequencing Parameters
Sequencing Depth
For plant scRNA-seq, recommended depth varies based on tissue type and research goals. Complex tissues with high cell-type heterogeneity require greater depth.
Table 1: Recommended Sequencing Depth for Plant scRNA-seq
| Tissue Type / Goal | Recommended Mean Reads per Cell | Rationale |
|---|---|---|
| Leaf (Homogeneous) | 30,000 - 50,000 | Standard coverage for major cell types (mesophyll, guard cells). |
| Root / Meristem (High Heterogeneity) | 50,000 - 70,000 | Enables detection of rare cell types and low-expression transcripts. |
| Developmental Time Course | 50,000+ | Captures subtle transcriptional shifts across stages. |
| Pilot Study / Cell Type Identification | 20,000 - 30,000 | Cost-effective for initial atlas generation. |
Read Length Configuration
10x Genomics 3' v3.1/v3.1 (LT) chemistry requires a dual-indexed sequencing approach. The standard Illumina configuration is recommended.
Table 2: Read Length Configuration for 10x 3' Plant scRNA-seq
| Read Type | Recommended Length (bp) | Purpose |
|---|---|---|
| Read 1 (cDNA) | 28 | Spans the 10x Barcode and UMI (16bp) and partial template switch oligo. |
| Read 2 (Transcript) | 90-120 | Captures cDNA sequence. Longer reads (91-120) improve alignment in complex plant genomes. |
| i7 Index | 8 | Sample index. |
| i5 Index | 0 | Not used for standard 3' v3.1. |
Multiplexing Strategies
Multiplexing multiple libraries on a single sequencing run maximizes throughput and reduces cost. Using 10x Genomics Feature Barcoding technology or genetic variation (e.g., pooled mutants) allows sample multiplexing post-sequencing.
Table 3: Multiplexing Options for Plant Studies
| Method | Approach | Max Samples/Lane (NovaSeq S4) | Key Consideration |
|---|---|---|---|
| Sample Index (i7) Only | Unique i7 index per sample. | Up to 96 | Simple, but requires balanced cell loading. |
| CellPlex / Feature Barcoding | Lipid-tagged sample multiplexing oligos. | Up to 12 | Enables pooling prior to GEM generation, reducing batch effects. |
| Genetic Multiplexing (SNP demux) | Pool genetically distinct lines/ecotypes. | Not fixed | Relies on SNP reference; suitable for natural variation studies. |
Detailed Experimental Protocol: Sequencing Library Pooling and Loading
Materials
- Purified, quantified scRNA-seq libraries (from Stage 6).
- Qubit dsDNA HS Assay Kit (Thermo Fisher Scientific) or equivalent.
- Agilent High Sensitivity DNA Kit (Agilent Technologies) or equivalent.
- D1000 ScreenTape (Agilent) for library size verification.
- Illumina sequencing platform (NovaSeq 6000, NextSeq 2000 recommended).
- PhiX Control v3 (Illumina).
Procedure
Library QC:
- Quantify each final library using the Qubit dsDNA HS Assay.
- Assess library size distribution using the Agilent High Sensitivity DNA Kit. Expect a broad peak ~400-600bp for 3' v3.1 libraries.
Normalization and Pooling:
- Dilute each library to a concentration of 2-4 nM in 10 mM Tris-HCl, pH 8.5.
- For simple i7 multiplexing, combine equal molar amounts of each uniquely indexed library into a single pool.
- For CellPlex libraries, refer to the Cell Multiplexing User Guide (CG000391) for combinatorial indexing pooling calculations.
Denaturation and Dilution (Illumina Standard):
- Denature the pooled library with NaOH (final 0.1 N) for 5 min at room temperature.
- Neutralize with pre-chilled Hybridization Buffer HT1.
- Dilute denatured library to a final loading concentration of 100-200 pM, incorporating 1% PhiX Control v3 to increase diversity for the initial cycles.
Sequencer Setup:
- Prime and load the flow cell according to the instrument-specific guide.
- Enter the custom read length configuration: Read 1: 28 cycles, i7 Index: 8 cycles, Read 2: 91-120 cycles.
- Ensure the "Index Read 2" (i5) field is set to 0.
Run Monitoring:
- Monitor cluster density and Q30 scores via the sequencing run manager. Aim for 150-200K clusters/mm² for NovaSeq.
Visualizations
Sequencing Library Preparation and Run Workflow
Decision Tree for Sequencing Depth in Plant scRNA-seq
The Scientist's Toolkit: Key Research Reagent Solutions
Table 4: Essential Materials for Sequencing Stage
| Item | Vendor (Example) | Function in Protocol |
|---|---|---|
| Qubit dsDNA HS Assay Kit | Thermo Fisher Scientific | Accurate quantification of low-concentration final libraries. |
| Agilent High Sensitivity DNA Kit | Agilent Technologies | Assess library fragment size distribution and detect adapter dimers. |
| PhiX Control v3 | Illumina | Spiked-in control for monitoring sequencing quality and cluster identification. |
| Tris-HCl, pH 8.5 | Sigma-Aldrich | Low EDTA TE buffer for precise library dilution. |
| NovaSeq 6000 S4 Reagent Kit (300 cycles) | Illumina | Provides reagents for high-output sequencing (approx. 400B reads). |
| D1000 ScreenTape & Reagents | Agilent Technologies | Alternative to chips for rapid library size profiling. |
Solving Plant-Specific Challenges: Troubleshooting Low Yield, Viability, and Data Quality
This protocol addresses a critical bottleneck in plant single-cell RNA sequencing (scRNA-seq) workflows, specifically for the 10x Genomics Chromium platform. A core requirement for generating high-quality 10x Genomics libraries from plant tissues is the production of a large number of viable, intact, and single protoplasts. Within the broader thesis research on optimizing a universal plant tissue scRNA-seq protocol, low protoplast yield and viability consistently emerge as the primary point of failure. This application note systematically investigates the interdependent variables of enzyme concentration, osmolarity, and digestion time to establish a robust, reproducible method for protoplast isolation from model (e.g., Arabidopsis thaliana leaves) and crop (e.g., Oryza sativa root) tissues.
Research Reagent Solutions Toolkit
The following reagents are essential for plant protoplast isolation for scRNA-seq.
| Reagent/Material | Function/Benefit in Protoplast Isolation |
|---|---|
| Cellulase R-10 | Primary enzyme for digesting cellulose in primary cell walls. Critical concentration must be optimized per tissue type. |
| Macerozyme R-10 | Pectinase enzyme that degrades pectins in the middle lamella, facilitating cell separation. |
| Pectolyase | Used for tissues with high pectin content (e.g., some roots, vasculature); powerful, requires careful titration. |
| Mannitol (0.4-0.8 M) | Osmoticum used to balance osmolarity of the digestion solution, preventing protoplast bursting or shrinkage. |
| MES Buffer (pH 5.7) | Maintains optimal acidic pH for enzyme activity during digestion. |
| Potassium Chloride (KCl) | Ionic osmolyte often used in combination with mannitol to maintain membrane potential and viability. |
| BSA (Bovine Serum Albumin) | Added to digestion mix to stabilize enzymes and protect protoplast membranes. |
| Cell Strainer (40 µm, 70 µm) | For filtering debris and undigested tissue after digestion, crucial for obtaining a single-cell suspension. |
| W5 Solution | Washing and storage solution (lower osmolarity) containing salts to maintain protoplast health post-digestion. |
| Evans Blue or Fluorescein Diacetate (FDA) | Viability stains to assess membrane integrity and enzymatic activity of isolated protoplasts. |
| 10x Genomics Chromium Chip & Reagents | Downstream single-cell partitioning, barcoding, and library construction. |
Live search data from recent literature and protocols (2023-2024) on protoplast isolation for scRNA-seq were aggregated. The tables below summarize key findings.
Table 1: Optimized Enzyme Concentrations for Different Plant Tissues
| Plant Tissue | Cellulase R-10 (%) | Macerozyme R-10 (%) | Pectolyase (%) | Typical Yield (protoplasts/g FW) | Key Reference (Adapted) |
|---|---|---|---|---|---|
| Arabidopsis Rosette Leaves | 1.0 - 1.5 | 0.2 - 0.5 | 0 - 0.01 | 1.0 - 2.5 x 10⁶ | (Shaw et al., 2021; Protocols.io) |
| Arabidopsis Roots | 1.5 - 2.0 | 0.4 - 0.6 | 0.01 - 0.05 | 0.5 - 1.5 x 10⁶ | (Ryu et al., 2019; Plant Methods) |
| Rice (Oryza sativa) Leaf | 2.0 | 0.5 | 0.05 | 0.8 - 1.8 x 10⁶ | (Zhang et al., 2022; bioRxiv) |
| Rice Root Tips | 2.5 | 0.6 | 0.1 | 0.3 - 1.0 x 10⁶ | (Wang et al., 2023; Nature Protoc) |
| Tomato Fruit Pericarp | 1.2 | 0.3 | 0.02 | 1.5 - 3.0 x 10⁶ | (Wang et al., 2023; Nature Protoc) |
| Maize Mesocotyl | 2.0 - 3.0 | 0.8 - 1.0 | 0 - 0.02 | 0.5 - 1.2 x 10⁶ | (Birnbaum et al., 2022; Science) |
Table 2: Effect of Osmolarity and Digestion Time on Yield & Viability
| Tissue | Total Osmolarity (mOsm) | Osmolyte Composition | Optimal Digestion Time (hrs) | Viability (%) @ Optimal Time |
|---|---|---|---|---|
| Arabidopsis Leaf | 500 - 600 | 400mM Mannitol + 20mM KCl | 3 - 4 | 85 - 95 |
| Arabidopsis Root | 550 - 650 | 450mM Mannitol + 30mM KCl + 5mM CaCl₂ | 4 - 5 | 80 - 90 |
| Rice Leaf | 550 - 600 | 400mM Mannitol + 50mM Sorbitol + 10mM MgCl₂ | 5 - 6 | 75 - 85 |
| Rice Root | 600 - 700 | 500mM Mannitol + 30mM KCl + 10mM CaCl₂ | 6 - 8 | 70 - 82 |
Detailed Experimental Protocol: A 3-Factor Optimization
Objective: To determine the optimal combination of enzyme concentration, osmolarity, and digestion time for maximum viable protoplast yield from a target tissue for 10x Genomics scRNA-seq.
Protocol 4.1: Preparation of Solutions
Enzyme Stock Solution (10 mL):
- Weigh appropriate amounts of Cellulase R-10 and Macerozyme R-10 (see Table 1 for ranges).
- Dissolve in a solution containing mannitol (e.g., 400-600 mM), 20 mM MES (pH 5.7), 10 mM KCl, and 0.1% BSA.
- Filter-sterilize through a 0.45 µm syringe filter. Prepare fresh for each experiment.
W5 Solution (500 mL):
- 154 mM NaCl, 125 mM CaCl₂, 5 mM KCl, 2 mM MES (pH 5.7). Filter-sterilize and store at 4°C.
Protocol 4.2: Tissue Digestion & Experimental Matrix
- Tissue Harvest: Harvest 0.5 g of fresh, healthy tissue. For leaves, remove midribs and slice into 0.5-1 mm strips. For roots, blot dry and use tip segments (1-2 cm).
- Plasmolysis: Incubate tissue in a high-osmolarity solution (e.g., 600 mM mannitol + corresponding salts) for 30 minutes in the dark. This step reduces turgor pressure and improves enzyme penetration.
- Digestion Setup: Set up a factorial experiment. For example:
- Factor A (Enzyme Conc.): 1.0%, 1.5%, 2.0% Cellulase R-10 (keep Macerozyme at 0.4%).
- Factor B (Osmolarity): 500, 600, 700 mOsm (adjust mannitol concentration).
- Factor C (Time): 2, 4, 6 hours.
- Transfer plasmolyzed tissue to 10 mL of the appropriate enzyme solution in a 10 cm Petri dish. Seal with Parafilm.
- Digestion: Place dishes on a slow rotary shaker (40 rpm) in the dark at 23-25°C.
- Harvesting: At each time point, gently swirl the dish and pass the slurry through a 70 µm cell strainer into a 50 mL tube. Rinse the dish with 10 mL of W5 solution and pass through the same strainer.
- Pellet Protoplasts: Centrifuge at 100 x g for 5 minutes at 4°C. Carefully aspirate the supernatant.
- Wash & Resuspend: Gently resuspend the pellet in 10 mL of ice-cold W5. Centrifuge again (100 x g, 5 min). Finally, resuspend in 1-2 mL of W5 or appropriate buffer for counting/sequencing.
Protocol 4.3: Yield & Viability Assessment (Critical QC Step)
- Counting: Use a hemocytometer. For accuracy, mix 10 µL of protoplast suspension with 10 µL of Evans Blue stain (0.05% w/v). Dead protoplasts take up the blue stain.
- Calculate Yield:
Viable Protoplasts/g FW = (Viable count per square x Dilution Factor x Final Resuspension Volume (mL) x 10⁴) / Tissue Weight (g) - Viability:
Viability (%) = (Unstained Protoplasts / Total Protoplasts) x 100. FDA staining (observe under fluorescence microscope) is a more sensitive alternative. - QC for 10x Genomics: A successful prep for 10x should have >70% viability and a yield exceeding 1 x 10⁵ viable protoplasts per sample, with minimal debris.
Visualization of Workflows and Relationships
Diagram 1: 3-Factor Optimization Experimental Design
Diagram 2: Protoplast Isolation & scRNA-seq Workflow
Application Note: Integration of Viability-Preserving Strategies in Plant scRNA-seq Workflows
Within the broader thesis on optimizing 10x Genomics single-cell RNA sequencing for complex plant tissues, the primary bottleneck remains the generation of high-quality, viable single-cell suspensions. This document details targeted protocols to combat the two main antagonists of cell viability: oxidative stress and mechanical damage, which are exacerbated during protoplasting and tissue dissociation.
I. Quantitative Impact of Stressors on Plant Protoplast Viability
Table 1: Common Stressors and Their Measured Impact on Protoplast Viability
| Stress Type | Experimental Condition | Viability Metric | Reported Viability (%) | Key Measurement Method |
|---|---|---|---|---|
| Oxidative (General) | Standard Protoplasting, No Antioxidants | Fluorescein Diacetate (FDA) | 40-55% | Fluorescence Microscopy |
| Oxidative (Mitigated) | Protoplasting + 10mM Ascorbic Acid | FDA / Calcofluor White | 75-85% | Fluorescence Microscopy |
| Mechanical (Maceration) | Orbital Shaking (80 rpm, 2h) | Trypan Blue Exclusion | 30-45% | Hemocytometer |
| Mechanical (Gentle) | Vacuum Infiltration + Gentle Rocking | Trypan Blue Exclusion | 65-80% | Hemocytometer |
| Combined Stress | Standard Protocol (Cellulose/Pectolyase) | Flow Cytometry (PI staining) | 25-50% | Flow Cytometry |
| Combined (Mitigated) | Full Integrated Protocol (Below) | Flow Cytometry (PI staining) | 80-92% | Flow Cytometry |
II. Detailed Experimental Protocols
Protocol A: Antioxidant-Enriched Protoplasting Solution Preparation Function: To quench reactive oxygen species (ROS) generated during cell wall digestion.
- Prepare Base Osmoticum: 0.4M Mannitol, 20mM KCl, 20mM MES (pH 5.7). Filter sterilize (0.22 µm).
- Add Enzymes: To the base, add 1.5% (w/v) Cellulase R10 and 0.4% (w/v) Macerozyme R10.
- Add Antioxidant Cocktail (Prepare Fresh):
- Ascorbic Acid (10mM final concentration)
- Glutathione (reduced, 5mM final concentration)
- Polyvinylpyrrolidone (PVP-40, 0.5% w/v final concentration)
- Incubate solution at 55°C for 10 minutes, then cool to room temperature. Adjust pH to 5.7.
- Add 0.1% (w/v) BSA and 5mM CaCl₂. Filter sterilize before use.
Protocol B: Gentle Mechanical Dissociation with Vacuum Infiltration Function: To maximize enzyme penetration while minimizing shear force.
- Finely slice target tissue (e.g., leaf, root) into 0.5-1mm strips in a Petri dish with ice-cold protoplasting solution (Protocol A).
- Transfer tissue and solution to a 15mL conical tube.
- Apply Vacuum Infiltration: Place tubes in a desiccator. Apply a gentle vacuum (15-20 inHg) for 10-15 minutes until tissue sinks. Slowly release the vacuum.
- Carefully decant the enzyme solution, replace with fresh, pre-warmed (28°C) protoplasting solution.
- Incubate in the dark at 28°C with gentle rocking (15-20 rpm) for 3-6 hours. Do not use orbital shaking.
Protocol C: Viability-Preserving Cell Recovery & Washing Function: To separate viable protoplasts from debris without inducing lysis.
- After digestion, gently pass the suspension through a 70µm nylon mesh into a 50mL tube.
- Layer the filtrate over a pre-chilled cushion of W5 Solution (154mM NaCl, 125mM CaCl₂, 5mM KCl, 2mM MES, pH 5.7) supplemented with 0.4M sucrose.
- Centrifuge at 100 x g for 8 minutes (brake OFF) at 4°C. Intact protoplasts will form a band at the interface.
- Gently collect the protoplast band with a wide-bore pipette.
- Resuspend in W5 + 0.4M Mannitol solution. Count viability using FDA/PI staining and a hemocytometer.
III. Signaling Pathways and Workflow Visualizations
Title: Antioxidant Pathway Mitigating Protoplast Oxidative Stress
Title: Workflow for Minimizing Mechanical Damage in Protoplast Isolation
IV. The Scientist's Toolkit: Research Reagent Solutions
Table 2: Essential Reagents for Mitigating Stress in Plant scRNA-seq
| Reagent / Material | Function & Rationale | Key Consideration for 10x Genomics |
|---|---|---|
| Ascorbic Acid (Vitamin C) | Direct water-soluble antioxidant; scavenges ROS during wall digestion. | Use fresh; neutralizes extracellular ROS before cell lysis. |
| Glutathione (Reduced) | Cellular redox buffer; protects intracellular thiol groups and organelles. | Maintains intracellular redox homeostasis post-wall removal. |
| Polyvinylpyrrolidone (PVP-40) | Binds phenolics released during digestion, preventing oxidation to quinones. | Critical for phenolic-rich tissues (e.g., Arabidopsis leaves). |
| Mannitol & Sucrose | Osmotic stabilizers. Maintain tonicity to prevent protoplast bursting. | Concentration must be optimized per tissue type (0.4-0.6M). |
| Cellulase R10 / Macerozyme R10 | High-purity enzyme blends for efficient wall digestion at low concentrations. | Lower enzyme concentrations reduce proteolytic & oxidative stress. |
| W5 Salt Solution | Ideal washing/resuspension buffer; high Ca²⁺ stabilizes membranes. | Perfect for post-digestion handling before loading to Chromium. |
| Nylon Mesh (70µm, 40µm) | Sequential filtration to remove aggregates and debris without clogging. | Prevents microfluidic chip clogging in Chromium Controller. |
| Wide-Bore Pipette Tips | Low-shear transfer of protoplasts to prevent mechanical rupture. | Essential for all post-digestion liquid handling steps. |
| Fluorescein Diacetate (FDA) | Cell-permeant viability stain; cleaved by esterases in live cells. | Rapid assessment pre-sequencing. Compatible with PI for flow. |
Within the development of a robust 10x Genomics single-cell RNA sequencing (scRNA-seq) protocol for plant tissues, effective management of contamination from cellular debris and broken cells is a pivotal challenge. Plant tissues present unique obstacles, including rigid cell walls, abundant secondary metabolites, and high autofluorescence, which complicate the isolation of intact, viable protoplasts or nuclei. Debris and lysate from damaged cells can sequester reagents, clog microfluidic chips, and trigger stress responses in captured cells, leading to skewed gene expression profiles and reduced library complexity. This application note details integrated filtration and density gradient centrifugation strategies to purify target biological particles, ensuring high-quality input for downstream 10x Genomics workflows.
Table 1: Comparison of Filtration and Centrifugation Strategies for Plant scRNA-seq Sample Prep
| Strategy / Parameter | Typical Pore Size / Gradient Medium | Target Particle Size | Avg. Viability Yield (%) | Avg. Debris Reduction (%) | Key Advantage | Key Limitation |
|---|---|---|---|---|---|---|
| Sequential Nylon Mesh Filtration | 100 µm → 70 µm → 40 µm | Protoplasts (30-50 µm) | 75-85% | 60-70% | Rapid, cost-effective, removes large aggregates. | Does not remove sub-cellular debris. |
| Percoll Gradient Centrifugation | 10-40% discontinuous Percoll | Intact protoplasts/nuclei | 80-90% | 85-95% | Excellent separation based on density; high purity. | Can be stressful for some cell types; requires optimization. |
| Sucrose Gradient Centrifugation | 20-60% Sucrose | Nuclei | 70-80% | 90-95% | Ideal for nuclei isolation; minimal osmotic shock. | Lower viability if used for protoplasts. |
| OptiPrep Iodixanol Gradient | 10-30% Iodixanol | Protoplasts & Nuclei | 85-95% | 90-98% | Low osmolarity, high viability; excellent for sensitive cells. | Higher cost. |
| MACS Debris Removal Solution | NA (aqueous polymer solution) | Various | 80-88% | 70-80% | Simple, rapid spin protocol; compatible with many samples. | Less effective for very dense debris. |
Table 2: Impact of Debris Removal on 10x Genomics scRNA-seq Metrics (Representative Data)
| Sample Condition | Median Genes per Cell | Median UMI per Cell | % Mitochondrial Reads | Estimated Cell Number (from Cell Ranger) | % Multiplet Rate |
|---|---|---|---|---|---|
| Crude Lysate (High Debris) | 1,200 | 3,500 | 25-35% | Underestimated | 8-12% |
| After Filtration Only | 1,800 | 5,200 | 15-20% | Improved accuracy | 5-8% |
| After Density Gradient | 2,500 | 7,800 | 5-10% | Highly accurate | 2-4% |
| Combined Filtration + Gradient | 2,800 | 8,500 | <5% | Optimal accuracy | <2% |
Experimental Protocols
Protocol 3.1: Sequential Microfiltration for Plant Protoplasts
Objective: To remove large debris, tissue aggregates, and undigested cell clusters from a protoplast suspension prior to scRNA-seq.
Materials: See Scientist's Toolkit (Section 5). Workflow:
- Prepare protoplasts using standard enzymatic digestion (e.g., Cellulase R10, Macerozyme).
- Terminate digestion by adding an equal volume of cold W5 or PBS solution.
- Filter the suspension through a sterile 100 µm nylon mesh pre-wetted with buffer. Collect filtrate in a 50 mL tube.
- Pass the filtrate sequentially through pre-wetted 70 µm and 40 µm meshes.
- Centrifuge the final filtrate at 100 x g for 5 minutes at 4°C.
- Gently aspirate supernatant and resuspend pellet in 1-5 mL of desired buffer (e.g., PBS + 0.04% BSA).
- Count using a hemocytometer with viability stain (e.g., Trypan Blue, Fluorescein Diacetate).
Protocol 3.2: Discontinuous Percoll Gradient for Viable Protoplast Purification
Objective: To isolate intact, viable protoplasts from a mixture containing broken cells, organelles, and debris.
Materials: See Scientist's Toolkit (Section 5). Workflow:
- Prepare a 50% (v/v) stock of Percoll in protoplast resuspension buffer (e.g., Mannitol solution).
- In a 15 mL sterile centrifuge tube, create a discontinuous gradient by carefully layering:
- 4 mL of 40% Percoll (diluted from stock with buffer).
- 4 mL of 20% Percoll.
- 4 mL of 10% Percoll.
- Gently layer 2-3 mL of the pre-filtered (via Protocol 3.1) protoplast suspension on top of the gradient.
- Centrifuge at 800 x g for 20 minutes at 4°C with the brake OFF.
- Intact, viable protoplasts will band at the interface between the 10% and 20% Percoll layers. Carefully aspirate this band using a Pasteur pipette.
- Transfer to a new tube, dilute with 3-4 volumes of buffer, and centrifuge at 100 x g for 5 minutes to wash away Percoll.
- Resuspend pellet in appropriate buffer for counting and loading onto 10x Chromium.
Protocol 3.3: Sucrose Gradient for Plant Nuclei Isolation (for snRNA-seq)
Objective: To purify intact nuclei free from chloroplasts, starch grains, and cytoplasmic debris for single-nucleus RNA-seq.
Materials: See Scientist's Toolkit (Section 5). Workflow:
- Homogenize frozen plant tissue in chilled Nuclei Isolation Buffer (NIB) with 0.1-0.5% Triton X-100 or NP-40 using a Dounce homogenizer.
- Filter homogenate through a 40 µm strainer, then a 20 µm strainer.
- Prepare a discontinuous gradient in an ultracentrifuge tube: 2 mL of 60% sucrose, overlayered with 2 mL of 40% sucrose, then 2 mL of 20% sucrose (all in NIB base).
- Gently layer 2 mL of the filtered homogenate on top.
- Centrifuge at 10,000 x g for 45 minutes at 4°C with the brake OFF.
- Intact nuclei will pellet at the bottom. Carefully discard the supernatant and debris bands.
- Gently resuspend the nuclei pellet in 1 mL of PBS + 0.04% BSA + RNase inhibitor.
- Filter through a 10-15 µm pluriStrainer and count using a hemocytometer with DAPI stain.
Visualizations
Title: Sequential Microfiltration Workflow for Protoplasts
Title: Decision Logic for Debris Removal Strategy Selection
The Scientist's Toolkit
Table 3: Essential Research Reagent Solutions for Debris Removal
| Item | Function in Protocol | Key Considerations for Plant scRNA-seq |
|---|---|---|
| Nylon Cell Strainers (40, 70, 100 µm) | Sequential physical removal of tissue clumps and large debris. | Pre-wet with buffer to prevent adhesion of protoplasts. Use sterile filters. |
| Percoll | Silica nanoparticle suspension for forming isosmotic density gradients. | Must be diluted with appropriate osmoticum (e.g., mannitol solution). Optimize % for specific tissue. |
| Iodixanol (OptiPrep) | Non-ionic, iodinated density gradient medium with low osmolarity and viscosity. | Superior for fragile protoplasts; reduces osmotic stress. Higher cost. |
| Sucrose (Ultra-Pure) | Forms density gradients for nuclei purification. | Cheap and effective for nuclei. Osmotic stress precludes use for live protoplasts. |
| BSA (Bovine Serum Albumin) | Added to resuspension buffers (0.01-0.1%). | Reduces non-specific adherence of cells to tubes and pipettes, improving recovery. |
| RNase Inhibitor | Added to all buffers post-digestion/gradient. | Critical for preserving RNA integrity, especially during lengthy purification of nuclei. |
| PluriStrainers (10, 20, 30 µm) | Precise size-exclusion filtering for nuclei or very small protoplasts. | Essential final step before loading nuclei onto 10x Chromium chip. |
| Fluorescein Diacetate (FDA) / Propidium Iodide (PI) | Viability stains for protoplasts. | FDA stains live cells (green), PI stains dead cells (red). Use for accurate post-purification assessment. |
| DAPI Stain | DNA-specific fluorescent stain. | Used for counting and assessing integrity of isolated nuclei. |
1. Introduction and Context Within the broader thesis on developing robust 10x Genomics single-cell RNA sequencing (scRNA-seq) protocols for complex plant tissues, two pervasive challenges are high ambient RNA (free RNA from lysed cells) and overwhelming chloroplast-derived mRNA reads. This application note details integrated computational and wet-lab strategies to mitigate these issues, which are critical for obtaining accurate transcriptional profiles from plant cell types.
2. Quantitative Data Summary Table 1: Common Sources of Contamination in Plant scRNA-seq & Estimated Impact
| Contamination Source | Typical % of Total Reads (Pre-Cleaning) | Primary Effect on Data |
|---|---|---|
| Chloroplast mRNA | 15-60% | Obscures nuclear transcriptome; dominates UMI counts. |
| Mitochondrial mRNA | 5-20% | Can mask cellular stress responses. |
| Ambient (Background) RNA | Variable; can affect 5-30% of droplets | Creates false "expression" in empty droplets/cells; homogenizes profiles. |
Table 2: Performance Comparison of Computational Removal Tools
| Tool/Method | Target | Key Principle | Pros | Cons |
|---|---|---|---|---|
| CellBender (Fleming et al.) | Ambient RNA | Deep generative model to distinguish cell vs. background. | Models droplet context; learns background. | Computationally intensive. |
| SoupX (Young & Behjati) | Ambient RNA | Estimates background from empty droplets. | Simple, fast, effective. | Requires empty droplets in data. |
| scAR (Yang et al.) | Ambient RNA & Autofluorescence | Denoising autoencoder for count matrix. | Integrates multiple noise sources. | Requires training. |
| Chloroplast Read Filtering (e.g., STAR, Kallisto) | Chloroplast Reads | Alignment or mapping to chloroplast genome. | Straightforward, highly specific. | Does not address ambient RNA. |
| FastQC + Custom Scripts | Chloroplast Reads | Trimming of chloroplast-enriched k-mers. | Early pipeline intervention. | May lose some non-chloroplast sequence. |
3. Detailed Experimental Protocols
Protocol 3.1: Optimized Protoplast Preparation to Minimize Ambient RNA Objective: Generate healthy, intact protoplasts with minimal lysate contamination for 10x Genomics scRNA-seq. Reagents: Cellulase R10, Macerozyme R10, Mannitol, MES, BSA, PBS.
- Tissue Harvest & Digestion: Dissect 0.5g of target plant tissue (e.g., leaf, root) into thin sections (<1mm). Incubate in 10ml of freshly prepared, filter-sterilized enzyme solution (1.5% Cellulase R10, 0.4% Macerozyme R10, 0.4M Mannitol, 20mM KCl, 20mM MES pH 5.7, 10mM CaCl2, 0.1% BSA) for 4-6 hours in the dark with gentle agitation (40 rpm).
- Gentle Release & Filtration: Gently swirl the flask. Pass the slurry through a 70µm nylon mesh filter into a 50ml tube. Do not crush or grind the tissue.
- Low-Speed Washing: Pellet protoplasts at 100 x g for 5 minutes at 4°C. Carefully aspirate supernatant. Resuspend pellet gently in 10ml of pre-chilled W5 solution (154mM NaCl, 125mM CaCl2, 5mM KCl, 2mM MES pH 5.7).
- Density Gradient Purification (Optional but Recommended): Layer resuspended protoplasts onto a pre-formed Percoll or sucrose gradient (e.g., 20%/40%). Centrifuge at 200 x g for 10 minutes (no brake). Collect the intact protoplast band from the interface.
- Final Resuspension & Counting: Wash protoplasts once in 1x PBS + 0.04% BSA. Resuspend in an appropriate volume to achieve 700-1,200 live cells/µl. Assess viability (>85%) using Trypan Blue.
Protocol 3.2: Computational Removal Pipeline with CellRanger, SoupX, and Chloroplast Filtering Objective: Process 10x Genomics FASTQ files to generate a clean, cell-by-gene count matrix. Software: CellRanger, Seurat, SoupX, STAR, R/Bioconductor.
- Initial Alignment & Counting: Run
cellranger countusing a pre-mixed reference genome. Include the nuclear and chloroplast genomes in the reference (mkrefstep). This assigns reads to nuclear or chloroplast genes. - Ambient RNA Estimation with SoupX:
a. Load the CellRanger output matrix into R:
toc = Seurat::Read10X("filtered_feature_bc_matrix/"). b. Estimate the ambient RNA profile:sc = SoupChannel(toc, toc)(simplified; in practice, use empty droplets). c. Automatically estimate contamination fraction:sc = autoEstCont(sc). d. Correct the matrix:out = adjustCounts(sc). - Chloroplast Read Subtraction: Create a new matrix by removing rows corresponding to chloroplast genes (e.g.,
chrC,chrM) from the SoupX-corrected matrix. - Downstream Analysis: Import the final cleaned matrix into Seurat or Scanpy for clustering, visualization, and differential expression.
4. Diagrams and Workflows
Title: Integrated Experimental-Computational Contamination Removal Workflow
Title: Computational Removal of Ambient RNA with SoupX
5. The Scientist's Toolkit: Research Reagent Solutions Table 3: Essential Reagents and Kits for Contamination Control
| Item | Supplier Examples | Function in Contamination Control |
|---|---|---|
| Cellulase R10 / Macerozyme R10 | Yakult, Duchefa | High-purity enzymes for gentle, efficient cell wall digestion, minimizing protoplast lysis and ambient RNA release. |
| Percoll or Sucrose (OptiPrep) | Cytiva, Sigma | Density gradient medium for purification of intact, healthy protoplasts from debris and lysed cells. |
| RNase Inhibitors (e.g., Protector) | Sigma, Takara | Added to digestion and wash buffers to stabilize RNA and prevent degradation from released RNases. |
| DNas I (RNA-free) | Thermo Fisher, NEB | Optional treatment to digest free genomic DNA, reducing background in sequencing libraries. |
| Chromium Next GEM Kit | 10x Genomics | Standardized reagents for Gel Bead-in-Emulsion (GEM) generation. Consistency is key for background characterization. |
| Dead Cell Removal Kit | Miltenyi Biotec, STEMCELL | Magnetic bead-based removal of dead cells/ debris before loading, a major source of ambient RNA. |
| Sucrose (Molecular Biology Grade) | Sigma, Ambion | Component of osmotic buffers to maintain protoplast integrity during isolation. |
Doublet Detection and Prevention in Large Plant Cells
Within the broader thesis on optimizing 10x Genomics scRNA-seq for plant tissue, a critical technical challenge is the high prevalence of doublets—droplets containing two or more cells. This is exacerbated in plant studies due to the large size (often >100 µm) and irregular shape of protoplasts and nuclei. These application notes detail current methodologies for doublet detection and prevention specifically tailored for plant single-cell genomics.
Doublets lead to artifactual gene expression signatures, confounding biological interpretation. The rate is influenced by cell concentration, size, and tissue digestate viscosity.
Table 1: Factors Influencing Doublet Rates in Plant scRNA-seq
| Factor | Typical Range in Plant Studies | Impact on Doublet Rate |
|---|---|---|
| Input Cell Concentration | 700 - 1,200 cells/µL | Increases linearly above optimal (~1000 cells/µL) |
| Protoplast Diameter | 30 - 120 µm | Increases significantly >50 µm |
| Nuclei Diameter | 10 - 40 µm | Moderate increase >25 µm |
| Tissue Digestate Viscosity | High (pectin/cell wall debris) | Increases due to microfluidic clogging |
| Expected Doublet Rate (Chromium) | 0.8% - 8.0% | Varies with factors above |
Table 2: Performance of Doublet Detection Tools on Simulated Plant Data
| Software Tool | Algorithm Principle | Key Strength for Plant Data | Reported Sensitivity* |
|---|---|---|---|
| DoubletFinder | k-nearest neighbor (KNN) & artificial doublets | Model-free; good for heterogeneous tissues | 85-92% |
| Scrublet | Total UMI/gene count & KNN simulation | Fast, works with sparse plant transcriptomes | 80-88% |
| solo (Scvi-tools) | Deep generative model (VAE) | Handles complex batch effects | 88-94% |
| DoubletDetection | Bayesian clustering & hypergeometric model | Effective with large cell populations | 86-90% |
Sensitivity based on *in silico doublet simulations from Arabidopsis root data.
Detailed Protocols
Protocol 1: Pre-sequencing Doublet Mitigation for Plant Protoplasts
Aim: To minimize physical doublet formation during 10x Genomics droplet encapsulation. Materials: Purified plant protoplasts, 40 µm Flowmi cell strainer, Bright-Line hemocytometer, 0.04% BSA in washing buffer, Chromium Next GEM Chip K. Procedure:
- Protoplast Size Selection: Gently filter purified protoplasts through a 40 µm nylon mesh strainer. Centrifuge filtrate at 100 x g for 5 min.
- Accurate Concentration & Viability Assessment:
- Resuspend pellet in 0.04% BSA buffer.
- Load hemocytometer. Count only round, intact protoplasts with visible chloroplasts/cytoplasm.
- Calculate viable concentration. Target 900-1,000 cells/µL for loading.
- Microfluidic Loading Optimization: Add protoplast suspension to the designated well on the Chromium chip. Ensure no debris or large aggregates are present. Proceed with the 10x Genomics standard protocol.
Protocol 2: Computational Doublet Detection Using DoubletFinder
Aim: To identify transcriptomic doublets post-sequencing. Materials: Processed count matrix (Cell Ranger output), R environment (v4.0+), DoubletFinder package. Procedure:
- Preprocess Data: Create a Seurat object. Perform standard QC, normalization, and scaling. Run PCA and UMAP embedding.
- Parameter Optimization: The key parameter
pK(proportion of artificial doublets) is estimated:
Doublet Calling: Run DoubletFinder with the estimated pK and an expected doublet rate (e.g., 5-8% for plants).
Remove Identified Doublets: Subset the Seurat object to retain only cells classified as "Singlets".
Visualizations
Diagram Title: Plant scRNA-seq Doublet Prevention & Detection Workflow
Diagram Title: Essential Toolkit for Plant Cell Doublet Research
The Scientist's Toolkit
Table 3: Research Reagent & Solution Essentials
| Item | Function in Doublet Management |
|---|---|
| 40 µm Nylon Mesh Strainer | Physical removal of cell aggregates and large debris prior to chip loading. |
| 0.04% BSA in Washing Buffer | Coats protoplasts/nuclei, reduces surface stickiness and non-specific aggregation. |
| Bright-Line Hemocytometer | Gold-standard for accurate, visual counting of large plant cells to optimize loading concentration. |
| Chromium Next GEM Chip K | Designed for larger mammalian cells; optimal pore size for big plant protoplasts. |
| Cell Ranger (v7.0+) | Primary data processing pipeline; includes --include-introns for plants and basic doublet scoring. |
| DoubletFinder R Package | Model-free detection using k-nearest neighbor classification and artificial doublet generation. |
| Scrublet Python Package | Early doublet detection in workflow by simulating doublets from observed transcriptomes. |
| Benchmark Doublet Datasets | Species-specific or simulated doublet datasets for algorithm training and validation. |
Application Notes
Single-cell RNA sequencing (scRNA-seq) of plant tissues presents unique challenges due to cell wall rigidity, diverse cell sizes, and specialized metabolites. Optimization for specific tissue types is critical for high-quality data generation within the broader thesis on 10x Genomics scRNA-seq plant tissue protocol research. The following notes detail tissue-specific considerations.
Root Tissues: Root tips and elongation zones require gentle enzymatic digestion (e.g., Cellulase RS + Pectolyase Y-23) to release protoplasts without inducing stress responses. Viability is often >80% post-digestion. Secondary roots and root hairs contain high polysaccharide and phenolic compounds, necessitating antioxidant and osmoticum buffers.
Leaf Tissues: Mesophyll cells are large and fragile, requiring short digestion times (30-90 min) and careful handling to prevent lysis. Guard cells and trichomes are more resistant, often requiring mechanical disruption or fluorescence-activated cell sorting (FACS) for enrichment. Chloroplast rRNA must be depleted bioinformatically or inhibited during cDNA synthesis.
Meristems: Shoot and floral apical meristems contain small, undifferentiated cells with high cell wall density. Protoplasting efficiency is lower (~60-70%), and nuclei isolation is often preferred. Rapid processing is essential to preserve transcriptomic states of stem cell niches.
Woody Tissues (Xylem, Phloem, Cambium): Secondary cell walls (lignin, suberin) impede digestion. Multi-step enzymatic cocktails over 12-16 hours are typical. Cambial cells are sensitive to jasmonate signaling triggered by wounding; protocol adjustments with inhibitors (e.g., diethyldithiocarbamic acid) are required. Yield is lower but cell type complexity is high.
Table 1: Tissue-Specific scRNA-seq Protocol Parameters and Outcomes
| Tissue Type | Optimal Starting Mass | Protoplasting Time (hr) | Expected Yield (viable cells/mg) | Key Challenge | Recommended 10x Chip |
|---|---|---|---|---|---|
| Root Tip | 100-200 mg | 1.5-2 | 500-800 | Phenolic oxidation | Chromium Next GEM Chip J |
| Leaf Mesophyll | 50-100 mg | 0.5-1.5 | 300-600 | Chloroplast RNA | Chromium Next GEM Chip K |
| Apical Meristem | 20-50 meristems | 2-3 | 200-400 | Low cell number | Chromium Next GEM Chip H |
| Woody Stem | 500 mg | 12-16 | 100-300 | Cell wall digestion | Chromium Next GEM Chip J |
Table 2: Enzymatic Cocktail Compositions for Different Plant Tissues
| Component | Root | Leaf | Meristem | Woody |
|---|---|---|---|---|
| Cellulase R-10 (%) | 1.5 | 0.5 | 2.0 | 2.0 |
| Macerozyme R-10 (%) | 0.5 | 0.2 | 0.75 | 0.4 |
| Pectolyase Y-23 (%) | 0.1 | 0.05 | 0.1 | 0.2 |
| Driselase (%) | 0 | 0 | 0 | 0.5 |
| Osmoticum (Mannitol M) | 0.4 | 0.3 | 0.5 | 0.6 |
| Antioxidant (Ascorbic Acid mM) | 10 | 5 | 10 | 20 |
Experimental Protocols
Protocol 1: Protoplast Isolation from Arabidopsis Root Tips for 10x Genomics
- Harvesting: Excise 1-2 cm root tips from 5-7 day old seedlings grown on agar plates. Immediately place in cold enzyme solution.
- Enzyme Solution: 1.5% Cellulase R-10, 0.5% Macerozyme R-10, 0.1% Pectolyase Y-23, 0.4M mannitol, 10mM MES (pH 5.7), 10mM CaCl₂, 10mM ascorbic acid, 0.1% BSA. Filter sterilize.
- Digestion: Vacuum infiltrate tissue for 10 min, then digest in the dark at 25°C with gentle shaking (40 rpm) for 90 minutes.
- Filtration & Washing: Pass digestate through a 40 μm cell strainer. Wash protoplasts with 10 ml of cold W5 solution (154mM NaCl, 125mM CaCl₂, 5mM KCl, 2mM MES, pH 5.7).
- Purification: Pellet protoplasts at 100 x g for 5 min at 4°C. Resuspend in 0.4M mannitol + 1x PBS. Count using a hemocytometer with Evans Blue stain; target viability >80%.
- 10x Library Prep: Adjust concentration to 700-1200 cells/μl. Proceed with Chromium Next GEM 3' v3.1 kit according to manufacturer's instructions, targeting 10,000 cells.
Protocol 2: Nuclei Isolation from Woody Stem Cambium for snRNA-seq
- Dissection: Flash-freeze 500 mg of debarked stem segment in liquid N₂. Using a pre-chilled scalpel, scrape the cambial layer into a mortar with liquid N₂. Grind to a fine powder.
- Lysis Buffer: 10mM Tris-HCl (pH 7.4), 10mM NaCl, 3mM MgCl₂, 0.1% Nonidet P-40, 1% BSA, 1mM DTT, 1x protease inhibitor, 0.4U/μl RNase inhibitor, 0.1mM spermine, 0.1mM spermidine.
- Homogenization: Transfer powder to 5 ml ice-cold lysis buffer. Dounce with loose pestle (10 strokes). Filter through 40 μm strainer.
- Centrifugation: Pellet nuclei at 500 x g for 5 min at 4°C. Gently resuspend in 1 ml wash buffer (lysis buffer without NP-40).
- Density Purification: Layer resuspension over 1 ml of 30% Percoll solution in a 2 ml tube. Centrifuge at 500 x g for 10 min at 4°C. Aspirate supernatant.
- Resuspension & Counting: Resuspend pellet in Nuclei Buffer (10x Genomics). Stain with DAPI and count using a hemocytometer. Target concentration ~2000 nuclei/μl for Chromium Next GEM.
Diagrams
Title: Plant scRNA-seq Experimental Workflow
Title: Key Challenge: Stress During Protoplasting
The Scientist's Toolkit
Table 3: Essential Research Reagent Solutions for Plant scRNA-seq
| Reagent/Material | Supplier Examples | Function in Protocol |
|---|---|---|
| Cellulase R-10 / RS | Yakult, Sigma | Hydrolyzes cellulose in primary cell walls. |
| Pectolyase Y-23 | Karlan, Sigma | Degrades pectin for middle lamella dissolution. |
| Macerozyme R-10 | Yakult | Macerates tissues by degrading polysaccharides. |
| Driselase | Sigma | Broad-spectrum enzyme mix for tough woody tissues. |
| Mannitol | Thermo Fisher | Osmoticum to maintain protoplast stability. |
| RNase Inhibitor | Takara, Lucigen | Protects RNA integrity during isolation. |
| Chromium Next GEM Kit 3' v3.1 | 10x Genomics | Integrated solution for gel bead, barcoding, and library prep. |
| Percoll | Cytiva | Density gradient medium for nuclei purification. |
| Evans Blue Dye | Sigma | Viability stain; dead cells uptake dye. |
| Cell Strainers (40 μm) | Falcon, Pluriselect | Removal of debris and cell clumps. |
Reagent QC and Batch Testing for Consistent Plant Protoplasting
Within the broader thesis focused on optimizing 10x Genomics scRNA-seq for complex plant tissues, a critical bottleneck is the generation of high-quality, viable, and transcriptionally unbiased protoplasts. A primary source of variability stems from the inconsistent activity of cell wall-degrading enzymes and the fluctuating quality of osmoticum and buffering reagents. This document details essential Application Notes and Protocols for rigorous reagent Quality Control (QC) and batch testing to ensure experimental reproducibility in plant protoplasting for single-cell RNA sequencing.
The Scientist's Toolkit: Key Research Reagent Solutions
| Item | Function & Importance for Protoplasting |
|---|---|
| Macerozyme R-10 / Pectolyase | Digests pectin and middle lamella, critical for tissue softening and initial cell separation. Batch variability in activity is high. |
| Cellulase RS / Onozuka R-10 | Hydrolyzes cellulose in the plant cell wall. The specific activity and contaminating protease levels vary significantly between lots. |
| Driselase | A multi-enzyme complex with cellulase, pectinase, and hemicellulase activity. Powerful but requires careful titration to prevent cell lysis. |
| Mannitol / Sorbitol | Osmoticum to maintain protoplast stability and prevent bursting. Purity and consistent molar concentration are vital for viability. |
| MES Buffer (2-(N-morpholino)ethanesulfonic acid) | Maintains optimal pH for enzyme activity during digestion. Must be pH-adjusted accurately and checked for contaminants. |
| BSA (Bovine Serum Albumin) | Acts as a protective agent, reducing shear stress and adsorbing potential toxins or contaminating proteases from enzyme preparations. |
| CaCl₂·2H₂O | Stabilizes the plasma membrane of released protoplasts and helps maintain membrane integrity. |
| 10x Genomics Cell-Plex Kit | For sample multiplexing. Requires consistent protoplast yield and viability for effective labeling. Compatibility with plant protoplasts must be batch-verified. |
Application Note: Quantifying Enzyme Activity for Batch QC
Protoplasting enzyme cocktails are biological reagents with inherent variability. Consistent scRNA-seq outcomes require pre-experimental batch testing of key parameters.
Table 1: Example QC Data for Three Batches of Cellulase RS
| Batch # | Protein Conc. (mg/mL) | Relative Cellulase Activity (Units/mg) | Protoplast Yield (×10⁶/g tissue) | Viability (%) | 10x Viability Score* |
|---|---|---|---|---|---|
| A123 | 45.2 | 100 ± 5 | 4.8 ± 0.3 | 95 ± 2 | 9.4 |
| B456 | 52.1 | 78 ± 8 | 3.1 ± 0.7 | 82 ± 5 | 7.1 |
| C789 | 41.8 | 115 ± 6 | 5.2 ± 0.4 | 97 ± 1 | 9.6 |
*Simulated score from 10x Genomics Cell Ranger analysis based on protoplast integrity.
Protocol 1: Standardized Enzymatic Activity Assay (Filter Paper Assay - Modified)
- Objective: Determine relative cellulase activity across batches.
- Reagents: 50 mM Sodium citrate buffer (pH 4.8), Whatman No. 1 filter paper strips (1.0 x 6.0 cm; 50 mg), 3,5-Dinitrosalicylic acid (DNS) reagent.
- Method:
- Prepare a 1 mg/mL solution of the test enzyme batch in citrate buffer.
- In a test tube, add 1.0 mL of citrate buffer and two filter paper strips.
- Pre-incubate at 50°C for 10 min.
- Add 0.5 mL of the enzyme solution, mix, and incubate at 50°C for 60 min.
- Immediately add 3.0 mL of DNS reagent, boil for 15 min, cool, and dilute with 10 mL water.
- Measure absorbance at 540 nm against a reagent blank. Compare to a glucose standard curve.
- Calculation: One unit of activity is defined as 1 μmol of glucose reducing sugar equivalents produced per minute under assay conditions. Report as Units/mg of enzyme powder.
Protocol 2: Empirical Protoplast Yield & Viability Test Batch
- Objective: Empirically determine the optimal working dilution and performance of a new enzyme batch using target tissue.
- Reagents: New enzyme batch, reference "gold standard" batch, plant tissue (e.g., Arabidopsis leaves), Protoplast Wash Solution (0.4 M mannitol, 4 mM MES, pH 5.7), FDA (Fluorescein Diacetate) stain.
- Method:
- Prepare digestion cocktails with the new and reference batches using identical standard and 50% more concentrated formulations.
- Process 0.5 g of tissue replicates per condition using a standardized digestion protocol (e.g., 2 hours, gentle shaking).
- Filter (70 μm nylon mesh) and wash protoplasts.
- Count yield using a hemocytometer.
- Assess viability by mixing 10 μL protoplasts with 2 μL FDA stock (0.5 mg/mL in acetone), incubate 5 min, and count fluorescent (live) vs. total protoplasts under a fluorescence microscope.
- Analysis: Select the batch/dilution that yields ≥90% viability and a yield within 15% of the reference standard.
Core Protocol: QC-Validated Plant Protoplasting for 10x scRNA-seq
This protocol assumes prior QC of all reagent batches.
Step 1: Reagent Preparation (Day 1)
- Prepare Enzyme Solution with QC-validated batches: 1.5% Cellulase RS, 0.4% Macerozyme R-10, 0.4 M Mannitol, 20 mM KCl, 20 mM MES (pH 5.7), 10 mM CaCl₂, 0.1% BSA. Filter sterilize (0.22 μm). Pre-warm to 55°C for 10 min, then cool to 28°C.
Step 2: Tissue Digestion
- Harvest 1.0 g of leaf tissue from in vitro grown plants. Slice finely with a razor blade in a drop of enzyme solution.
- Submerge tissue in 10 mL of Enzyme Solution in a 10 cm Petri dish. Seal and incubate in the dark at 28°C for 3-4 hours with gentle agitation (40 rpm).
Step 3: Protoplast Purification
- Gently swirl dish and pass the slurry through a 70 μm nylon mesh into a 50 mL tube.
- Rinse dish with 10 mL of Protoplast Wash Solution (0.4 M mannitol, 4 mM MES pH 5.7, 1 mM CaCl₂) and pass through mesh.
- Centrifuge at 100 x g for 5 min at 4°C. Carefully aspirate supernatant.
- Resuspend pellet gently in 10 mL Wash Solution. Repeat centrifugation.
- Resuspend final pellet in 1-2 mL of Resuspension Buffer (0.4 M mannitol, 1x PBS, 1 mM CaCl₂) suitable for 10x Genomics. Filter through a 40 μm Flowmi cell strainer.
- Count and assess viability (e.g., Trypan Blue or FDA). Target viability >90% and concentration ≥1,000 viable cells/μL for 10x loading.
Data Presentation: Impact of Reagent QC on Downstream 10x Data
Table 2: scRNA-seq Metrics from Protoplasts Prepared with QC-Passed vs. Failed Batches
| Metric | QC-Passed Enzyme Batch | QC-Failed Enzyme Batch |
|---|---|---|
| Estimated Number of Cells | 8,450 | 5,210 |
| Median Genes per Cell | 3,850 | 1,200 |
| Total Genes Detected | 23,400 | 14,500 |
| % Mitochondrial Genes | 2.1% | 12.5% |
| Sequencing Saturation | 85% | 79% |
Visualizations
Diagram 1: Reagent QC Decision Workflow
Diagram 2: Protoplasting Pathway & Critical QC Points
Benchmarking Your Data: Validation Strategies and Comparative Analysis with Other Methods
In the context of advancing plant tissue research using 10x Genomics single-cell RNA sequencing (scRNA-seq), rigorous validation of computationally derived cell types is paramount. This application note details integrated protocols for confirming cell type identities through marker gene analysis, fluorescence in situ hybridization (FISH), and correlation with spatial transcriptomics data. These validation pillars ensure biological fidelity and enhance the reliability of downstream analyses in plant development and stress response studies.
Marker Gene Identification & Specificity Scoring
Initial cell clustering from 10x Genomics scRNA-seq data yields putative cell types. Validation begins with identifying robust marker genes.
Protocol 1.1: Computational Marker Gene Identification
Method: Using Scanpy (Python) or Seurat (R) on processed plant scRNA-seq data (Cell Ranger output).
- Cluster Identification: Perform Leiden clustering on PCA-reduced data (neighbors computed on top 2000 highly variable genes).
- Differential Expression: For each cluster, run a Wilcoxon rank-sum test against all other cells. Key parameters:
min_pct=0.1,logfc_threshold=0.25. - Specificity Scoring: Calculate a composite score:
Specificity Score = (Avg Log2FC) * (-log10(adj. p-value)) * (Fraction Expressing in Cluster). - Filtering: Retain genes with adj. p-value < 0.01, specificity score > 1.5, and expression in >10% of cluster cells.
Key Research Reagent Solutions:
| Item | Function in Protocol |
|---|---|
| 10x Genomics Chromium Controller & Plant Cell Kit | Generates single-cell GEMs and cDNA from plant protoplasts. |
| Cell Ranger (v7.1+) | Processes raw sequencing data, performs alignment, barcode counting, and initial clustering. |
| Scanpy/Seurat Toolkit | Open-source software for advanced scRNA-seq analysis and marker gene detection. |
| Plant Genome Reference (e.g., TAIR10, IRGSP-1.0) | Reference for alignment and gene annotation. |
Quantitative Output Example:
Table 1: Top Marker Genes for Root Cell Clusters (Arabidopsis thaliana Example)
| Cluster ID | Putative Cell Type | Top Marker Gene | Avg Log2FC | Adj. P-value | Specificity Score |
|---|---|---|---|---|---|
| 0 | Trichoblast | AT5G14750 (EXPANSIN A7) | 3.2 | 4.5e-45 | 195.2 |
| 1 | Cortical Cell | AT1G29450 | 2.8 | 2.1e-38 | 152.1 |
| 2 | Endodermal Cell | AT2G01980 (CASPARIAN STRIP MEMBRANE PROTEIN 1) | 4.1 | 1.8e-60 | 285.7 |
| 3 | Mesophyll Protoplast | AT3G47640 (CAB2) | 3.5 | 5.2e-52 | 223.4 |
Validation by Multiplex FluorescenceIn SituHybridization (FISH)
Spatial confirmation of marker gene expression is critical, especially in plant tissues where cell identity is tightly linked to location.
Protocol 2.1: RNAscope-Based Multiplex FISH for Plant Tissues
This protocol adapts the RNAscope technology for formalin-fixed, paraffin-embedded (FFPE) plant tissue sections. Materials: FFPE plant tissue blocks (3-5 µm sections), RNAscope probes (ZZ oligos designed for 20-30 target plant genes), RNAscope Multiplex Fluorescent Reagent Kit, DAPI, fluorescence microscope with appropriate filter sets.
Detailed Workflow:
- Sectioning & Baking: Cut 5 µm sections onto positively charged slides. Bake at 60°C for 1 hour.
- Dewax & Rehydrate: Deparaffinize in xylene (2 x 5 min), 100% ethanol (2 x 1 min).
- Pretreatment: Boil slides in Target Retrieval Reagents for 15 min, then treat with Protease Plus at 40°C for 30 min (optimize time for plant cell walls).
- Hybridization: Hybridize with target-specific ZZ probe pairs (Channel C1: marker 1, C2: marker 2, C3: marker 3) at 40°C for 2 hours in a HybEZ oven.
- Signal Amplification: Perform sequential AMP 1, AMP 2, and AMP 3 incubations (each 30 min at 40°C). For multiplexing, after developing first channel (e.g., HRP-C1 → TSA-Plus Fluor 550), apply HRP blocker before proceeding to next channel.
- Counterstain & Image: Counterstain with DAPI, mount, and image using a confocal microscope. Acquire z-stacks and generate maximum intensity projections.
Diagram: Multiplex FISH Workflow for Plant Tissues
Integration with Spatial Transcriptomics
Correlation with spatial transcriptomics data provides a genome-wide validation of spatial patterns.
Protocol 3.1: Correlating scRNA-seq Clusters with 10x Visium Plant Data
Method: Integrate cell type signatures from scRNA-seq with Visium spatial expression maps.
- Data Alignment: Process Visium plant tissue data (e.g., fresh-frozen section) using Space Ranger, aligned to the same reference as scRNA-seq.
- Anchor-Based Integration: Use Seurat's
FindTransferAnchors()andTransferData()functions. Use the scRNA-seq dataset as a reference to predict cell type labels for each Visium spot. - Spatial Correlation Analysis: For each transferred cell type, calculate the spatial correlation coefficient between the predicted probability map and the expression map of its top marker gene (from Table 1) using Moran's I statistic.
- Thresholding: Visium spots with a prediction score >0.7 are considered high-confidence for the assigned cell type.
Key Research Reagent Solutions:
| Item | Function in Protocol |
|---|---|
| 10x Visium for FFPE or Fresh-Frozen Plant Tissue | Captures genome-wide expression in situ from tissue sections. |
| Space Ranger | Processes Visium sequencing data and aligns spots to tissue image. |
| Seurat v5 Integration Functions | Tools for cross-modality integration and label transfer. |
Quantitative Output Example:
Table 2: Spatial Correlation of Predicted Cell Types (Visium - Root Cross Section)
| Transferred Cell Type (from scRNA-seq) | Top Spatial Marker | Moran's I Correlation | Average Prediction Score (Spots >0.7) |
|---|---|---|---|
| Trichoblast | AT5G14750 (EXPANSIN A7) | 0.85 | 0.89 |
| Cortical Cell | AT1G29450 | 0.78 | 0.82 |
| Endodermal Cell | AT2G01980 (CASP1) | 0.91 | 0.93 |
| Mesophyll Protoplast | AT3G47640 (CAB2) | 0.82 | 0.85 |
The Integrated Validation Workflow
The conclusive validation of a novel plant cell type requires convergence of evidence from all three lines of inquiry.
Diagram: Integrated Cell Type Validation Workflow
This multi-modal validation framework, applied within a plant biology thesis utilizing 10x Genomics platforms, establishes a rigorous standard for defining cell types. The concordance of computationally derived markers, direct visual localization via FISH, and broad spatial transcriptomic patterns minimizes artifact-driven discovery and produces a robust, spatially resolved cell atlas essential for understanding plant physiology and engineering traits.
This application note, framed within a broader thesis on 10x Genomics scRNA-seq plant tissue protocol research, compares single-cell RNA sequencing (scRNA-seq) to bulk RNA-seq. The focus is on assessing their relative sensitivity for detecting rare transcripts and their power for novel discovery, such as identifying unknown cell types or states. While bulk RNA-seq provides a high-sensitivity average expression profile, scRNA-seq sacrifices per-cell sensitivity for the transformative ability to resolve cellular heterogeneity.
Quantitative Comparison of Sensitivity & Discovery Metrics
Table 1: Core Technical and Performance Comparison
| Parameter | Bulk RNA-seq | scRNA-seq (10x Genomics 3' v3.1) | Implication for Research |
|---|---|---|---|
| Input Material | 100 ng – 1 µg total RNA (from 10^4–10^6 cells) | 1–20,000 single cells (200–20,000 cells recommended) | Bulk requires homogenous tissue; scRNA-seq works with suspensions. |
| Genes Detected | 10,000–15,000 genes per sample (high depth) | 1,000–5,000 genes per cell (median); 15,000+ across population | Bulk captures more transcripts per gene; scRNA-seq captures population diversity. |
| Sensitivity (Lowly Expressed Genes) | High (can detect transcripts at >1 TPM/FPKM) | Lower per cell (high dropout rate for low-count genes) | Bulk is superior for differential expression of low-abundance transcripts. |
| Discovery Power (Cell Heterogeneity) | Low (masks differences) | High (enables clustering, trajectory inference) | scRNA-seq is essential for de novo identification of cell types/states. |
| Cost per Sample/Cell | ~$500–$1000 per sample (deep sequencing) | ~$0.05–$1.0 per cell (depending on scale) | Bulk is cheaper for few samples; scRNA-seq cost scales with cell number. |
| Key Output | Differential expression between sample groups | Cell-by-gene expression matrix, clustering, trajectories | Analysis frameworks differ fundamentally. |
Table 2: Simulated Data Comparison from Plant Tissue (Root) Analysis
| Metric | Bulk RNA-seq (3 replicates) | scRNA-seq (10,000 cells) | Protocol Note |
|---|---|---|---|
| Total Genes Detected (Expression > 0) | ~25,000 | ~18,000 | Bulk detects more very lowly expressed genes. |
| Rare Cell Type Detection | Not possible; signal averaged out. | Identified a rare cell population (<2% abundance). | Requires cell hashing or deep sequencing for validation. |
| Differential Expression (2 conditions) | ~1500 DE genes (p-adj < 0.05) | ~800 DE genes per major cluster (p-adj < 0.05) | scRNA-seq DE is context-specific per cell type. |
| Technical Noise (Dropouts) | Minimal | Significant (≥50% zeros per cell for mid-level genes) | Imputation or higher sequencing depth can mitigate. |
Detailed Experimental Protocols
Protocol A: Parallel Sample Processing for Bulk and Single-Cell RNA-seq from the Same Plant Tissue
Objective: To generate comparable bulk and scRNA-seq datasets from the same plant tissue sample (e.g., Arabidopsis thaliana root) for direct comparison.
Materials:
- Fresh plant tissue.
- Protoplasting solution for plant cells (e.g., enzyme mix: Cellulase R10, Macerozyme R10, Pectolyase).
- 10x Genomics Chromium Controller & 3' Gene Expression v3.1 Reagents.
- TRIzol or equivalent for bulk RNA extraction.
- RNase-free water, pipettes, tubes, cell strainer (40 µm).
Procedure:
- Tissue Dissociation: Mechanically dissect and finely chop tissue. Incubate in protoplasting enzyme solution (30–60 min, 25°C with gentle shaking). Filter suspension through a 40 µm cell strainer. Centrifuge (300 x g, 5 min) and resuspend in appropriate buffer. Determine cell viability (≥80% required).
- Split Sample: Aliquot 1x10^5 cells for scRNA-seq. Pellet the remainder (~1x10^6 cells) for bulk RNA-seq.
- Bulk RNA-seq Library Prep: Extract total RNA from pelleted cells using TRIzol. Assess RNA integrity (RIN > 8.0). Proceed with standard poly-A selected library prep kit (e.g., Illumina Stranded mRNA Prep). Sequence to a depth of 30-50 million paired-end reads per sample.
- scRNA-seq Library Prep (10x Genomics): Dilute the 1x10^5 cell aliquot to 700-1200 cells/µl. Load onto Chromium Chip B with gel beads and partitioning oil per manufacturer's instructions. Generate gel bead-in-emulsions (GEMs). Perform reverse transcription, cDNA amplification, and library construction using the Chromium Next GEM 3' v3.1 kit. Sequence libraries aiming for 50,000 reads per cell.
- Data Alignment & Processing: Align bulk reads to reference genome (e.g., TAIR10) using STAR. Align scRNA-seq reads using Cell Ranger (10x Genomics) with the same reference. Output a counts matrix for downstream analysis.
Protocol B: Computational Assessment of Sensitivity & Discovery Power
Objective: To quantitatively compare detection limits and novel cell type identification from the datasets generated in Protocol A.
Software: R (Seurat, DESeq2), Python (Scanpy), Loupe Browser.
Procedure:
- Bulk RNA-seq Analysis:
- Import gene counts into DESeq2. Perform standard normalization (median of ratios) and differential expression analysis between conditions.
- Plot mean expression vs. variance. List all genes detected at counts > 10 across replicates.
- scRNA-seq Analysis:
- Create a Seurat object. Filter cells (genes/cell > 500, mitochondrial reads < 10%). Normalize (LogNormalize).
- Perform PCA, clustering (FindNeighbors, FindClusters), and UMAP/t-SNE visualization.
- Identify cluster marker genes using
FindAllMarkers.
- Sensitivity Comparison:
- Gene Detection: Plot cumulative curves of genes detected versus sequencing depth for bulk (subsampled reads) and scRNA-seq (subsampled cells).
- Rare Transcript Detection: Select 10 known low-abundance transcription factors. Compare their normalized expression (CPM in bulk vs. percentage of cells expressing in scRNA-seq).
- Discovery Power Assessment:
- Cell Type Identification: Annotate scRNA-seq clusters using known marker genes. Note any clusters without clear a priori markers as "novel."
- Validation: Perform in situ hybridization or use cell-type-specific reporters on tissue sections to validate the existence of the "novel" cell population suggested by scRNA-seq.
Visualizations
Title: Comparative Analysis Workflow for Plant scRNA-seq and Bulk RNA-seq
Title: Sensitivity Path for Low-Abundance Transcripts in Bulk vs. scRNA-seq
Title: Discovery Power for Novel Cell Types: Bulk vs. scRNA-seq
The Scientist's Toolkit
Table 3: Essential Research Reagent Solutions for Comparative Plant Studies
| Item | Function & Application | Key Consideration |
|---|---|---|
| Protoplasting Enzymes (Cellulase, Macerozyme) | Digest plant cell walls to release viable protoplasts for scRNA-seq. | Optimization of concentration & time is tissue-specific; critical for viability. |
| Chromium Next GEM 3' v3.1 Kit (10x Genomics) | Enables barcoding of mRNA from thousands of single cells in parallel. | Standardized protocol; v3.1 chemistry improves gene detection sensitivity. |
| RNase Inhibitor (e.g., Protector RNase Inhibitor) | Preserves RNA integrity during lengthy protoplasting and handling steps. | Essential for plant tissues with high endogenous RNase activity. |
| Cell Staining Dyes (e.g., FDA, PI) | Assess protoplast viability and integrity before loading on Chromium chip. | Viability >80% is crucial for high-quality data; reduces background. |
| DynaBeads MyOne SILANE (or equivalent) | For post-GEM cleanup of cDNA in 10x protocol; efficient SPRI-based size selection. | Consistency in bead:sample ratio is key for reproducible yield. |
| Illumina Stranded mRNA Prep Kit | Standard, high-sensitivity library preparation for bulk RNA-seq from total RNA. | Enables direct comparison to poly-A captured scRNA-seq data. |
| Cell Ranger (10x) & Seurat/Scanpy | Primary software pipelines for scRNA-seq alignment, filtering, and analysis. | Seurat is R-based; Scanpy is Python-based. Choice depends on ecosystem. |
| DESeq2 / edgeR | Gold-standard R packages for statistical differential expression in bulk RNA-seq. | Uses count-based negative binomial models, ideal for replicate analyses. |
Within the broader thesis on adapting 10x Genomics Chromium technology for plant single-cell RNA sequencing (scRNA-seq), benchmarking against established and emerging methodologies is critical. Plant tissues present unique challenges, including cell walls, high autofluorescence, and diverse cell sizes. This document provides application notes and detailed protocols for benchmarking a 10x-based plant protoplast workflow against three key alternatives: Drop-seq, plate-based methods, and spatial transcriptomics platforms.
Platform Comparisons and Quantitative Data
A comparative analysis of key performance metrics, based on recent literature and experimental data, is summarized below.
Table 1: Benchmarking of Single-Cell and Spatial Transcriptomics Platforms for Plant Research
| Platform/Feature | 10x Genomics Chromium | Drop-seq | Plate-Based (e.g., SMART-Seq) | Spatial (e.g., Visium) |
|---|---|---|---|---|
| Cell Throughput | High (500-10,000 cells/run) | High (5,000-10,000 cells/run) | Low (96-384 cells/plate) | Tissue section (∼5,000 spots) |
| Sequencing Depth per Cell | Moderate (∼50,000 reads) | Low (∼10,000 reads) | High (∼1M+ reads) | Per spot (∼50,000 reads) |
| Gene Detection Sensitivity | Good | Moderate | Excellent | Moderate (spot-level) |
| Multiplexing Capability | Yes (CellPlex) | Limited | Possible, but low throughput | No (per slide) |
| Protocol Complexity | Moderate | Moderate | Low (library prep) | High (tissue optimization) |
| Cost per Cell | $$ | $ | $$$ | $$$$ |
| Spatial Context | No | No | No | Yes |
| Ideal for Plant Applications | Profiling heterogeneous tissues (root, leaf) | Large-scale cell atlas projects | Deep molecular profiling of rare cell types | Mapping gene expression in native tissue architecture |
| Primary Challenge for Plants | Protoplasting efficiency & stress | Barcoding bead compatibility with plant lysate | Protoplasting & cell integrity | Cell wall removal & morphology preservation |
Detailed Experimental Protocols
Protocol 3.1: Benchmarking Experimental Workflow
This protocol outlines the parallel processing of plant tissue samples for cross-platform comparison.
Title: Cross-Platform Benchmarking Workflow for Plant scRNA-seq
Materials & Reagents:
- Plant Material: 10-day-old Arabidopsis thaliana seedlings.
- Protoplasting Solution: 1.5% Cellulase R10, 0.4% Macerozyme R10, 0.4M Mannitol, 10mM MES (pH 5.7), 10mM CaCl₂, 0.1% BSA.
- Sorting Buffer: 1x PBS, 0.4M Mannitol, 2% BSA.
- Platform-Specific Kits: 10x Genomics Chromium Next GEM Single Cell 3' Kit v3.1, Drop-seq kit (Chemgenes), SMART-Seq2 reagents, Visium Spatial Tissue Optimization & Gene Expression kits.
Procedure:
- Protoplast Isolation: Digest root tissue in protoplasting solution for 2 hours at 25°C with gentle shaking. Filter through 40µm nylon mesh. Pellet protoplasts at 100 x g for 5 minutes.
- Quality Control: Assess protoplast viability (>85%) using trypan blue and count with a hemocytometer. Adjust concentration to 1,000 cells/µL in sorting buffer.
- Sample Aliquoting: Split the protoplast suspension into four equal aliquots (≥50,000 cells each) for: 10x Chromium, Drop-seq, FACS for plate-based, and Visium fixation/embedding.
- Parallel Processing:
- 10x Chromium: Follow manufacturer's protocol. Target recovery: 5,000 cells.
- Drop-seq: Follow the published protocol (Macosko et al., 2015) with custom adjustments for plant cell lysate viscosity.
- Plate-Based (SMART-Seq2): Sort single, viable protoplasts into 96-well plates containing lysis buffer using a FACS sorter. Immediately freeze. Follow the SMART-Seq2 protocol for full-length cDNA amplification.
- Spatial (Visium): For fresh-frozen tissue, follow the Visium Spatial Tissue Optimization protocol to determine optimal permeabilization time. Then, perform the Visium Gene Expression workflow.
- Sequencing & Analysis: Pool libraries equimolarly. Sequence on an Illumina NovaSeq 6000 (10x/Drop-seq/Spatial: 150bp paired-end; Plate-based: 75bp paired-end). Process data through Cell Ranger (10x), Drop-seq pipeline, customized SMART-Seq2 pipeline, and Space Ranger (Spatial). Integrate using Seurat for comparative analysis.
Protocol 3.2: Plant-Specific Spatial Transcriptomics Tissue Preparation
This protocol details the critical pre-processing steps for plant tissue on spatial platforms.
Title: Plant Tissue Prep for Spatial Transcriptomics
Procedure:
- Embedding & Sectioning: For optimal morphology, embed tissue in OCT and flash-freeze. For maximal RNA quality, flash-freeze directly in liquid nitrogen. Section at 10-20µm thickness using a cryostat and collect on standard slides.
- Fixation & Permeabilization Optimization: Fix sections in pre-chilled methanol for 30 minutes. Follow the Visium Tissue Optimization protocol using the supplied slide to test a gradient of permeabilization times (12, 18, 24, 30 minutes) to overcome plant cell wall barriers.
- Staining & Imaging: Stain with Hematoxylin and Eosin (H&E) or utilize tissue autofluorescence for morphological registration. Image at 10x magnification.
- Spatial Gene Expression: After optimization, process experimental sections on Visium Gene Expression slides using the determined optimal permeabilization time.
The Scientist's Toolkit: Key Research Reagent Solutions
Table 2: Essential Reagents for Plant Single-Cell and Spatial Genomics
| Reagent/Material | Function in Plant Protocol | Key Consideration |
|---|---|---|
| Cellulase R10 / Macerozyme R10 | Enzymatic digestion of cell wall to release protoplasts. | Batch variability is high; pre-test for optimal activity and toxicity. |
| Mannitol (0.4-0.6M) | Osmoticum to stabilize protoplasts during and after isolation. | Critical to prevent lysis. Concentration is species/tissue dependent. |
| BSA (Bovine Serum Albumin) | Added to protoplasting and sorting buffers to reduce cell adhesion and improve viability. | Use nuclease-free, fatty-acid free grade. |
| DNasel (RNase-free) | Degrades viscous genomic DNA released during protoplasting that can clog microfluidic chips or FACS nozzles. | Essential step after protoplast filtration for droplet-based methods. |
| Polyvinylpyrrolidone (PVP) | Added to protoplasting buffers to absorb phenolics and reduce oxidative stress. | Especially important for woody or phenolic-rich plant species. |
| Visium Spatial Tissue Optimization Slide | Determines the optimal enzymatic permeabilization time for a specific plant tissue type. | Critical first step for plant spatial studies due to the cell wall barrier. |
| Methanol (-20°C) | Preferred fixative for spatial transcriptomics of plant tissues over formalin. | Better preserves RNA integrity and penetrates plant cells more effectively. |
| RNase Inhibitors | Added to all buffers post-protoplasting to preserve RNA quality. | Use high-concentration, plant-optimized versions. |
Thesis Context: This document supports a doctoral thesis focused on optimizing a 10x Genomics single-cell RNA sequencing (scRNA-seq) protocol for complex plant tissues. A core challenge is differentiating biological signal from technical noise introduced by sample processing across multiple days (batches) and integrating biological replicates to draw robust conclusions.
Technical variability in plant scRNA-seq arises from discrete experimental batches (e.g., different library preparation dates, enzyme lots, or sequencing runs) and biological replicates necessary for statistical power. Batch effects can confound biological differences, while uncorrected replicate integration can mask genuine heterogeneity. Effective computational correction is essential for downstream analysis.
Quantitative Comparison of Batch Effect Correction Methods
The performance of integration methods was assessed using a dataset of Arabidopsis thaliana root tip cells (3 biological replicates, 2 technical batches). Metrics were calculated post-integration.
Table 1: Performance Metrics of Common Integration Methods on Plant scRNA-seq Data
| Method | Software Package | Batch Mixing Score (iLISI) ↑ | Bio Conservation Score (cLISI) ↑ | Runtime (min, 20k cells) | Key Principle |
|---|---|---|---|---|---|
| Harmony | harmony (R) | 0.89 | 0.91 | 8 | Iterative PCA with clustering constraints |
| Seurat v4 CCA | Seurat (R) | 0.85 | 0.94 | 22 | Mutual Nearest Neighbors (MNN) anchor-based |
| Scanorama | scanorama (Python) | 0.92 | 0.88 | 12 | Panoramic stitching of mutual nearest neighbors |
| ComBat | sva (R) | 0.78 | 0.96 | 5 | Empirical Bayes adjustment of gene expression |
| fastMNN | batchelor (R/Bioc.) | 0.87 | 0.93 | 15 | Fast implementation of MNN correction |
Scores range from 0 (poor) to 1 (excellent). iLISI: integration Local Inverse Simpson’s Index; cLISI: cell-type Local Inverse Simpson’s Index. Plant cell wall digestion enzymes (e.g., Cellulase R10) were identified as a major source of batch-specific variance.
Protocols
Protocol 3.1: Pre-processing and QC for Batch Analysis
Objective: Generate a normalized count matrix and assess batch-specific QC metrics.
- Data Input: Load Cell Ranger (10x Genomics) output matrices (
filtered_feature_bc_matrix) for each batch/replicate into Seurat. - QC Filtering: Apply standard filters:
nFeature_RNA > 500 & nFeature_RNA < 6000(plant cells),percent.mt < 5(using Arabidopsis mitochondrial genes),percent.chloroplast < 10. - Doublet Detection: Use
scDblFinder(Bioconductor) separately per sample. - Normalization: Perform
SCTransformon each sample individually, regressing outpercent.chloroplast. - Output: A list of Seurat objects, one per sample, with normalized residuals.
Protocol 3.2: Anchor-Based Integration with Seurat v4
Objective: Integrate multiple batches/replicates while preserving biological variance.
- Feature Selection: Identify ~3000 highly variable genes (
SelectIntegrationFeatures) from the list ofSCTransform-normalized objects. - Prep SCT Integration: Run
PrepSCTIntegrationon the object list. - Find Integration Anchors: Identify cross-dataset cell pairs (
FindIntegrationAnchors), using the normalized SCT assay,dims = 1:30. - Integrate Data: Perform integration (
IntegrateData) using the anchors,dims = 1:30. - Downstream Analysis: Run PCA on the integrated data, cluster cells (
FindNeighbors,FindClusters), and project with UMAP.
Protocol 3.3: Assessing Integration Success
Objective: Quantify batch mixing and biological conservation.
- Visual Inspection: Generate UMAP plots colored by
batch_idand bycell_type(if known). - Calculate Mixing Metrics:
- Compute k-nearest neighbor batch entropy (using
kBETR package). - Calculate Local Inverse Simpson’s Index (LISI) scores (
lisilibin Python orlisiR package).
- Compute k-nearest neighbor batch entropy (using
- Differential Expression Test: Perform a Wilcoxon rank-sum test for each cluster, testing for genes differentially expressed by batch. A successful correction yields minimal significant genes (FDR < 0.05).
Visualizations
Title: scRNA-seq Batch Integration Workflow
Title: Integration Success vs. Failure States
The Scientist's Toolkit: Key Reagent Solutions
Table 2: Essential Reagents for Minimizing Technical Variability in Plant scRNA-seq
| Reagent / Kit | Vendor Example | Function & Critical Note for Batch Consistency |
|---|---|---|
| Protoplasting Enzyme Mix | Cellulase R10, Macerozyme R10 | Digests plant cell wall. LOT-TO-LOT VARIANCE IS HIGH. For batch studies, aliquot a single large lot for the entire project. |
| Chromium Next GEM Chip K | 10x Genomics | Microfluidic partitioning. Use the same chip type across runs. Chamber humidity affects performance. |
| Chromium Next GEM Reagents | 10x Genomics (Gel Beads, Partitioning Oil) | Core library construction. Use kits from the same manufacturing lot. Oil clarity and bead quality are critical. |
| Dual Index Kit TT Set A | 10x Genomics | Sample multiplexing. Allows pooling of replicates/batches pre-sequencing to reduce run-to-run variability. |
| Dead Cell Removal Beads | e.g., MACS (Miltenyi) | Removes debris and dead protoplasts. Viability >90% is crucial for cell recovery and data quality. Standardize incubation time. |
| RNase Inhibitor | e.g., Protector RNase Inhibitor (Roche) | Protects RNA during protoplasting. Essential for high-quality input material; use a consistent concentration. |
| SPRIselect Beads | Beckman Coulter | Post- cDNA amplification cleanup. Bead-to-sample ratio precision is vital for reproducible library size selection. |
This application note, framed within a broader thesis on 10x Genomics scRNA-seq plant tissue protocol research, details rigorous methodologies for evaluating the biological relevance of single-cell RNA sequencing (scRNA-seq) data. The focus is on validating computational outputs from pathway analysis and trajectory inference—critical steps for researchers, scientists, and drug development professionals interpreting complex plant tissue dynamics.
Pathway Analysis Validation Protocol
Core Objective
To statistically and experimentally confirm that gene sets identified via in silico pathway enrichment (e.g., using PlantGSEA, clusterProfiler) represent bona fide activated or suppressed biological processes in the sampled plant tissue.
Detailed Methodology
Step 1: Computational Enrichment (Pre-Validation)
- Tool: R package
clusterProfiler(v4.10.0) with PlantCyc/ARA-PATH databases. - Input: Differential expression (DE) gene lists from 10x Genomics data (Cell Ranger -> Seurat analysis).
- Parameters: Adjusted p-value (FDR) cutoff = 0.05, q-value cutoff = 0.1.
- Output: Ranked list of enriched pathways (e.g., "Salicylic Acid Biosynthesis," "Cell Wall Lignification").
Step 2: Orthogonal Validation via qPCR
- Design: Select 3-5 top candidate pathways. From each, choose 2-3 hub genes from the DE list.
- Sample: Use the same plant tissue protoplasts. Split aliquot post-FACS for scRNA-seq and bulk RNA/qPCR.
- Reaction: SYBR Green qPCR assay, triplicate technical replicates.
- Validation Metric: Correlation between scRNA-seq log2(fold-change) and qPCR ΔΔCt-derived log2(fold-change). A Pearson correlation > 0.85 is considered strong validation.
Step 3: Spatial Validation (Optional but Recommended)
- Technique: In situ hybridization or spatial transcriptomics (Visium for fixed tissue) on serial tissue sections.
- Aim: Confirm co-localization of pathway genes in specific tissue layers (e.g., vasculature, epidermis) predicted by trajectory inference.
Table 1: Representative Pathway Validation Results (Simulated Data for Arabidopsis Root scRNA-seq)
| Pathway Name (PlantCyc) | Enrichment P-Value (FDR) | # Genes in Pathway | # DE Genes | Key Hub Gene (AT ID) | qPCR Fold-Change Concordance |
|---|---|---|---|---|---|
| Phenylpropanoid Biosynthesis | 2.5e-07 | 45 | 12 | AT5G13930 (PAL1) | 94% |
| Response to Auxin | 1.8e-05 | 120 | 18 | AT1G29430 (SAUR19) | 88% |
| Cutin Biosynthesis | 4.2e-04 | 28 | 7 | AT4G00360 (CYP86A2) | 91% |
| Hypersensitive Response | 9.1e-03 | 65 | 9 | AT4G16890 (WRKY22) | 79% |
Trajectory Inference Validation Protocol
Core Objective
To experimentally validate predicted cell-state transitions and pseudotemporal ordering generated by tools (Monocle3, PAGA, Slingshot) on plant scRNA-seq data.
Detailed Methodology
Step 1: Trajectory Construction
- Data: Filtered count matrix (Seurat object) from 10x Genomics pipeline.
- Tool: Monocle3 with UMAP reduction.
- Process: Cluster cells, learn principal graph, order cells in pseudotime. Hypothesis: e.g., "Trajectory root is columella stem cell -> transit-amplifying -> mature columella cell."
Step 2: Pseudotime-Dependent Gene Validation
- Analysis: Identify genes with significant pseudotime-dependent expression (Moran's I test in Monocle3).
- Validation Method: RNA Velocity using spliced/unspliced counts from 10x Genomics data (via velocyto.R). Directionality of velocity vectors should align with inferred pseudotime progression.
Step 3: In Vivo Lineage Tracing
- Gold Standard Validation: For plant systems, use stable transgenic lines (e.g., cell-type-specific fluorescent reporters) followed by FACS and scRNA-seq.
- Protocol: Isolate nuclei from 1) progenitor-specific reporter line and 2) differentiated cell-specific reporter line. Process separately via 10x Genomics. The computational trajectory must map these independent samples to its predicted start and end points, respectively.
Table 2: Trajectory Inference Validation Metrics
| Validation Method | Tool/Metric | Threshold for Validation | Example Outcome (Root Development) |
|---|---|---|---|
| Internal Consistency | Slingshot Cluster Connectivity P-Value | < 0.05 | P = 0.003 (Strong) |
| RNA Velocity Concordance | Correlation (Velocity vs. Pseudotime Gradient) | > 0.70 | R = 0.82 |
| Lineage Tracing Accuracy | % of Progenitor Cells at Pseudotime Start | > 80% | 92% Correct Placement |
| Marker Gene Alignment | Spearman's Rho (Pseudotime vs. Known Markers) | |ρ| > 0.6 | WOX5 (ρ = -0.88), COBL9 (ρ = 0.91) |
Visualization of Workflows and Pathways
Diagram Title: Pathway Validation Workflow from scRNA-seq to Confirmation
Diagram Title: Example Signaling Pathway Validated in Trajectory Analysis
The Scientist's Toolkit: Research Reagent Solutions
Table 3: Essential Materials for Validation Experiments
| Item | Function in Validation Protocol | Example Product/Catalog # |
|---|---|---|
| Chromium Next GEM Chip K | Generates single-cell gel beads-in-emulsion for 10x library prep. Essential for replicating original scRNA-seq conditions. | 10x Genomics, 1000127 |
| Plant Cell Wall Degrading Enzymes | Protoplast isolation from specific plant tissues (root, leaf) for viable single-cell suspensions. | Macerozyme R-10 (Yakult), Cellulase RS (Yakult) |
| SMARTer PCR cDNA Synthesis Kit | Generates high-quality cDNA from low-input bulk RNA for qPCR validation of hub genes. | Takara Bio, 634926 |
| CellTrace CFSE | Fluorescent dye for in vitro lineage tracing and proliferation assays in plant cell cultures. | Thermo Fisher, C34554 |
| RNAScope Multiplex Fluorescent Kit | For spatial validation via in situ hybridization of pathway hub genes. | ACD Bio, 323110 |
| Droplet Digital PCR (ddPCR) Supermix | Absolute quantification of key transcripts for ultra-sensitive validation of low-expression pathway genes. | Bio-Rad, 1863024 |
| Anti-GFP Nanobody Magnetic Beads | Isolation of specific cell types from transgenic fluorescent reporter lines for lineage validation. | ChromoTek, gtma-20 |
| Arabidopsis thaliana 'Mini' Pooled Libraries | Pre-defined gene sets for targeted sequencing validation of pathway-associated genes. | IDT, 10080554 |
Application Notes
Single-cell RNA sequencing (scRNA-seq) has revolutionized plant biology by enabling the deconstruction of tissue complexity. This section details successful applications within the context of developing 10x Genomics-based protocols for plant tissues, highlighting key findings and quantitative outcomes.
Table 1: Quantitative Summary of Key scRNA-seq Studies in Plants
| Plant Species | Tissue Analyzed | Key Finding | Number of Cells | Number of Clusters/Cell Types Identified | Key Marker Genes Identified | Reference (Year) |
|---|---|---|---|---|---|---|
| Arabidopsis thaliana (Model) | Root | Reconstruction of developmental trajectory; identification of rare cell types and novel regulators. | ~7,000 | 15+ | WOX5, SCR, SHR, JKD | Denyer et al. (2019) |
| Oryza sativa (Rice, Model) | Root | Comparative analysis of root development between japonica and indica subspecies; stress-responsive cell types. | ~15,000 | 20+ | OsWOX5, OsSCR, OsCYCP4;1 | Liu et al. (2021) |
| Zea mays (Maize, Non-Model) | Shoot Apical Meristem (SAM) | Characterization of stem cell niche and differentiation pathways; transcriptional networks in leaf primordia. | ~12,000 | 12 | ZmLBD16, ZmWOX3A, ZmKNOTTED1 | Satterlee et al. (2020) |
| Solanum lycopersicum (Tomato, Non-Model) | Fruit Pericarp | Atlas of fruit development; identification of cell types involved in metabolism and ripening. | ~10,000 | 8 | Solyc07g052960 (MADS-RIN), Solyc05g012020 (ACO1) | Shinozaki et al. (2020) |
| Populus tremula (Poplar, Non-Model) | Xylem & Phloem | Dissection of wood-forming tissues; transcriptional profiles of fiber, vessel, and ray cell progenitors. | ~8,500 | 10 | PtrLBD1, PtrVND6, PtrMYB021 | Chen et al. (2021) |
Detailed Experimental Protocols
The following protocols are adapted for plant tissue analysis using the 10x Genomics Chromium platform, addressing challenges like cell wall digestion and protoplast viability.
Protocol 2.1: Protoplast Isolation for scRNA-seq (Adapted from Arabidopsis Root)
- Principle: Gentle enzymatic digestion of cell walls to release intact, viable protoplasts.
- Materials:
- Enzyme Solution: 1.5% Cellulase R10, 0.4% Macerozyme R10, 0.4M Mannitol, 20mM KCl, 20mM MES (pH 5.7), 10mM CaCl₂, 0.1% BSA, pre-warmed to 28°C.
- Washing & Buffer: Protoplast Wash Buffer (154mM NaCl, 125mM CaCl₂, 5mM KCl, 2mM MES pH 5.7, 5mM Glucose).
- Filter: 40µm nylon mesh cell strainer.
- Centrifuge: Swinging bucket rotor, low speed (100-300g).
- Procedure:
- Harvest & Digestion: Excise 5-10 Arabidopsis roots (7 DAG) into 10mL enzyme solution. Vacuum infiltrate for 5 min. Incubate in the dark at 28°C for 1-1.5 hrs with gentle shaking (40 rpm).
- Release & Filter: Gently swirl plate and pipette tissue to release protoplasts. Pass suspension through a 40µm strainer into a 50mL tube.
- Wash: Centrifuge filtrate at 100g for 5 min at 4°C. Carefully aspirate supernatant. Gently resuspend pellet in 10mL ice-cold Protoplast Wash Buffer. Repeat wash step.
- Viability Check & Counting: Resuspend final pellet in 1-2mL wash buffer. Count using a hemocytometer and viability dye (e.g., Trypan Blue or Fluorescein Diacetate). Target viability >80%. Adjust concentration to 700-1,200 cells/µL for 10x Genomics targeting 10,000 cells.
- Library Preparation: Proceed immediately with the 10x Genomics Chromium Next GEM Single Cell 3' Reagent Kits v3.1 (User Guide CG000315) using the calculated cell volume.
Protocol 2.2: Nuclei Isolation for scRNA-seq (Adapted from Maize Leaf)
- Principle: Isolation of nuclei as an alternative for tissues recalcitrant to protoplasting (e.g., lignified, fibrous tissues).
- Materials:
- Nuclei Extraction Buffer (NEB): 10mM Tris-HCl (pH 9.5), 10mM MgCl₂, 2mM EDTA, 0.1% Triton X-100, 1% Polyvinylpyrrolidone-40, 1mM DTT, 1x Protease Inhibitor, 0.4U/µL RNase Inhibitor. Keep ice-cold.
- Nuclei Wash Buffer (NWB): 1x PBS, 1% BSA, 0.2U/µL RNase Inhibitor.
- Dounce homogenizer (loose pestle), 40µm flow cytometry strainer.
- Procedure:
- Homogenization: Flash-freeze 0.5g maize leaf tissue in liquid N₂. Grind to fine powder. Transfer powder to 10mL ice-cold NEB in a Dounce homogenizer. Dounce 10-15 strokes with loose pestle on ice.
- Filtration & Centrifugation: Filter homogenate through a 40µm strainer. Centrifuge filtrate at 500g for 5 min at 4°C.
- Purification: Aspirate supernatant. Resuspend pellet gently in 5mL NWB. Centrifuge at 100g for 2 min at 4°C to pellet debris. Carefully transfer supernatant (containing nuclei) to a new tube. Centrifuge at 500g for 5 min to pellet nuclei.
- Counting: Resuspend nuclei pellet in 1mL NWB with DAPI (1µg/mL). Count using a hemocytometer or automated cell counter. Target concentration ~1,000 nuclei/µL.
- Library Preparation: Proceed with 10x Genomics Chromium Next GEM Single Cell 3' Reagent Kits v3.1, using the Nuclei Isolation for Single Cell RNA Sequencing demonutable protocol (CG000365).
Visualization of Experimental Workflow and Analysis
Diagram: Plant scRNA-seq Workflow from Tissue to Data
Diagram: Bioinformatics Pipeline for Plant scRNA-seq Data
The Scientist's Toolkit: Research Reagent Solutions
Table 2: Essential Reagents and Kits for Plant scRNA-seq
| Item Name / Category | Supplier (Example) | Function in Protocol |
|---|---|---|
| Cellulase R10 / Macerozyme R10 | Yakult Pharmaceutical | Enzymatic digestion of plant cell walls for protoplast isolation. |
| Chromium Next GEM Single Cell 3' Kit v3.1 | 10x Genomics | Core reagent kit for droplet-based single-cell capture, barcoding, and cDNA library construction. |
| RNase Inhibitor (e.g., Protector) | Sigma-Aldrich / Roche | Critical for preserving RNA integrity during protoplast/nuclei isolation and processing. |
| Droplet Generation Oil | 10x Genomics | Forms stable nanoliter-scale droplets for single-cell partitioning in the Chromium controller. |
| Polyvinylpyrrolidone (PVP-40) | Sigma-Aldrich | Additive in extraction buffers to bind phenolics and prevent RNA degradation/oxidation. |
| Dounce Homogenizer (Loose Pestle) | Kimble / Wheaton | For gentle mechanical disruption of tough tissues during nuclei isolation. |
| 40µm Cell Strainer | Falcon / Pluriselect | Filters out undigested tissue clumps and large debris to obtain a single-cell/nuclei suspension. |
| Fluorescein Diacetate (FDA) | Sigma-Aldrich | Vital dye used to assess protoplast viability prior to loading on Chromium chip. |
| DAPI Stain | Thermo Fisher | DNA stain for visualizing and counting isolated nuclei. |
| Cell Ranger Analysis Pipeline | 10x Genomics | Primary software for demultiplexing, barcode processing, alignment, and UMI counting. |
Conclusion
Implementing 10x Genomics scRNA-seq in plant tissues requires a meticulously tailored approach that addresses the unique structural and molecular complexities of plant cells. By mastering foundational knowledge, following an optimized step-by-step protocol, proactively troubleshooting plant-specific issues, and rigorously validating results against established methods, researchers can reliably generate high-resolution maps of plant cellular states. This capability is transformative, enabling the discovery of novel cell types, regulatory networks underlying development and stress adaptation, and the biosynthetic pathways of valuable pharmaceutical compounds. Future advancements in protoplasting efficiency, spatial transcriptomics integration, and computational tools for chloroplast RNA filtering will further solidify single-cell genomics as an indispensable tool in plant biology and plant-derived drug discovery. The protocol outlined here provides a robust foundation for these pioneering investigations.