GhCLA1 and GoPGF: Dual Marker Genes for Optimizing RNAi and CRISPR Silencing Efficiency
This article provides a comprehensive guide for researchers on utilizing GhCLA1 and GoPGF as visual marker genes for rapidly assessing and optimizing gene silencing efficiency in plants.
GhCLA1 and GoPGF: Dual Marker Genes for Optimizing RNAi and CRISPR Silencing Efficiency
Abstract
This article provides a comprehensive guide for researchers on utilizing GhCLA1 and GoPGF as visual marker genes for rapidly assessing and optimizing gene silencing efficiency in plants. We explore their foundational biology, detail methodological applications in RNAi and CRISPR-Cas systems, address common troubleshooting and optimization challenges, and provide comparative validation frameworks against other assessment methods. This resource is tailored for scientists and drug development professionals seeking robust, quick, and reliable phenotyping tools to accelerate functional genomics and therapeutic discovery pipelines.
Understanding GhCLA1 and GoPGF: The Biology Behind Two Powerful Visual Marker Genes
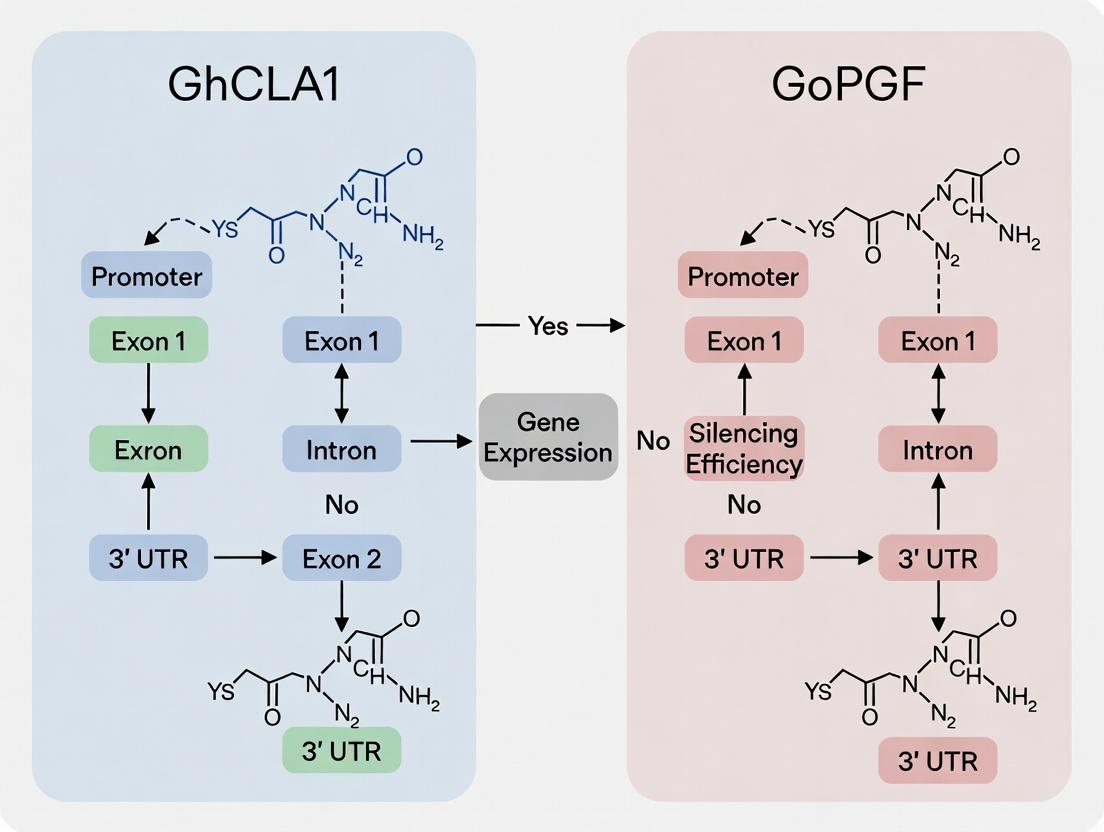
Functional genomics seeks to understand the relationship between genotype and phenotype, with gene silencing being a pivotal technique for interrogating gene function. Within this domain, visual phenotypic markers provide direct, often rapid, readouts of silencing efficiency and biological effect. This whitepaper frames its discussion within the context of a specific research thesis investigating silencing efficiency using the marker genes GhCLA1 (Gossypium hirsutum) and GoPGF (Gaultheria odorata). GhCLA1, a homolog of Arabidopsis CLA1 involved in chloroplast development, and GoPGF, a gene regulating anthocyanin pigmentation, serve as exemplary visual reporters. Silencing GhCLA1 results in albino or chlorophyll-deficient phenotypes, while silencing GoPGF leads to a loss of purple pigmentation. The visibility of these changes offers a powerful, quantitative means to assess the efficacy and spatial distribution of gene silencing vectors, such as those based on Virus-Induced Gene Silencing (VIGS) or RNA interference (RNAi).
Core Marker Genes: GhCLA1 and GoPGF
GhCLA1 (Cloroplastos Alterados 1):
- Function: A Gossypium hirsutum homolog of Arabidopsis DXS (1-deoxy-D-xylulose-5-phosphate synthase), a key enzyme in the plastidial MEP pathway for isoprenoid and chlorophyll biosynthesis.
- Visual Phenotype: Effective silencing results in a striking albino or pale-yellow phenotype due to arrested chloroplast development. The degree of whitening correlates with silencing efficiency.
- Research Utility: Provides a non-destructive, high-contrast visual marker for quantifying silencing spread and potency in photosynthetic tissues.
GoPGF (PROANTHOCYANIDIN FACTOR):
- Function: A regulatory gene in Gaultheria odorata controlling anthocyanin biosynthesis.
- Visual Phenotype: Silencing leads to a loss of purple/red anthocyanin pigmentation in stems, leaves, or fruits, resulting in green or light-green tissues.
- Research Utility: Offers a distinct, visually scorable marker in both photosynthetic and non-photosynthetic tissues, useful for comparative studies.
Table 1: Quantitative Phenotypic Scoring of Silencing Markers
| Marker Gene | Wild-Type Phenotype | Silenced Phenotype | Scoring Index (0-3) | Typical Onset Post-Inoculation | Tissue Specificity |
|---|---|---|---|---|---|
| GhCLA1 | Green leaves | Albino/Chlorotic | 0: Wild-type, 1: Slight chlorosis, 2: Partial albino, 3: Full albino | 7-14 days (VIGS) | Young leaves, shoot apices |
| GoPGF | Purple stems/veins | Green | 0: Full purple, 1: Moderate loss, 2: Significant loss, 3: Complete green | 10-21 days (Agro-infiltration) | Stems, leaf veins, fruit skin |
Experimental Protocols for VIGS-Based Silencing Efficiency Assays
Protocol 3.1: VIGS Vector Construction for GhCLA1/GoPGF
- Fragment Amplification: Amplify a 300-500 bp gene-specific fragment from GhCLA1 or GoPGF cDNA using primers with incorporated restriction sites (e.g., BamHI, XbaI).
- Cloning into VIGS Vector: Digest the pTRV2 (Tobacco Rattle Virus-based) vector and the PCR fragment. Ligate the fragment into the linearized vector.
- Transformation: Introduce the recombinant pTRV2-Gene and the helper pTRV1 plasmids into Agrobacterium tumefaciens strain GV3101 via electroporation.
- Confirmation: Verify constructs by colony PCR and sequencing.
Protocol 3.2: Plant Agro-infiltration and Phenotyping
- Agrobacterium Culture: Grow overnight cultures of Agrobacterium containing pTRV1 and pTRV2-Gene. Resuspend to an OD₆₀₀ of 1.0 in infiltration buffer (10 mM MES, 10 mM MgCl₂, 200 µM acetosyringone).
- Inoculum Preparation: Mix the pTRV1 and pTRV2-Gene cultures in a 1:1 ratio. Incubate at room temperature for 3-4 hours.
- Plant Infiltration: Pressure-infiltrate the mixed culture into the abaxial side of cotyledons or true leaves of 2-week-old seedlings using a needless syringe.
- Growth Conditions: Maintain infiltrated plants under standard growth conditions (e.g., 22-24°C, 16-h light/8-h dark).
- Phenotypic Monitoring & Scoring: Visually monitor plants daily. Beginning at day 7-10, photograph and score phenotypic severity weekly using the defined scoring indices (Table 1). Quantify areas of phenotype using image analysis software (e.g., ImageJ).
Protocol 3.3: Molecular Validation of Silencing Efficiency
- RNA Extraction: Extract total RNA from phenotypically scored tissue (both marked and unmarked areas) using a TRIzol-based method.
- cDNA Synthesis: Synthesize first-strand cDNA using reverse transcriptase.
- qRT-PCR Analysis: Perform quantitative PCR using gene-specific primers for GhCLA1 or GoPGF. Normalize expression levels to a stable internal reference gene (e.g., Ubiquitin or EF1α).
- Data Analysis: Calculate relative expression (2^(-ΔΔCt)). Correlate mRNA reduction levels with visual phenotypic scores.
Signaling and Biosynthetic Pathways
Silencing of GhCLA1 Blocks Chlorophyll Biosynthesis Pathway
GoPGF Regulates Anthocyanin Pathway for Pigmentation
Experimental Workflow for Marker-Based Silencing Research
Workflow for Visual Marker-Based Silencing Research
The Scientist's Toolkit: Research Reagent Solutions
Table 2: Essential Materials for Visual Phenotypic Marker Experiments
| Item | Function/Description | Example Vendor/Product |
|---|---|---|
| VIGS Vector System | Bipartite vector system for virus-induced gene silencing. Essential for delivering silencing constructs. | pTRV1/pTRV2 (Arabidopsis Stock Center), pTY-S (for Solanaceae) |
| Agrobacterium Strain | Used for plant transformation and delivery of VIGS constructs via agro-infiltration. | A. tumefaciens GV3101, LBA4404 |
| Acetosyringone | Phenolic compound that induces vir gene expression in Agrobacterium, critical for efficient T-DNA transfer. | Sigma-Aldrich, D134406 |
| Infiltration Buffer | Provides optimal pH, ionic strength, and inducer concentration for agro-infiltration. | Typically 10 mM MES, 10 mM MgCl₂, 200 µM acetosyringone |
| High-Fidelity DNA Polymerase | For accurate amplification of gene-specific fragments to be cloned into VIGS vectors. | Thermo Fisher Scientific (Phusion), NEB (Q5) |
| RNA Isolation Kit | For high-quality total RNA extraction from plant tissues for downstream qRT-PCR validation. | Thermo Fisher (PureLink RNA Mini Kit), Qiagen (RNeasy Plant Mini Kit) |
| Reverse Transcriptase Kit | Synthesizes first-strand cDNA from isolated RNA for gene expression analysis. | Takara Bio (PrimeScript RT), Bio-Rad (iScript cDNA Synthesis) |
| qPCR Master Mix (SYBR Green) | For quantitative real-time PCR to measure target gene (GhCLA1/GoPGF) transcript levels. | Thermo Fisher (PowerUp SYBR), Bio-Rad (iTaq Universal SYBR) |
| Image Analysis Software | Quantifies the area and intensity of visual phenotypes (albino, color loss) from digital images. | ImageJ/Fiji, Adobe Photoshop with analysis tools |
This whitepaper details the functional role of GhCLA1, a cotton homolog of the Arabidopsis CLAVATA1 gene, in shoot apical meristem (SAM) development and its perturbation leading to an albino phenotype. The content is framed within a broader thesis investigating GhCLA1 and GoPGF as critical marker genes for evaluating gene silencing efficiency in Gossypium hirsutum. GhCLA1 encodes a leucine-rich repeat receptor-like kinase (LRR-RLK) essential for maintaining SAM homeostasis by regulating the balance between stem cell proliferation and organ differentiation. Silencing or mutation of GhCLA1 disrupts this balance, leading to meristem enlargement and a severe chloroplast development defect, manifesting as a heritable albino phenotype. This guide provides a comprehensive technical resource, integrating current molecular data, experimental protocols, and visualization tools for researchers in plant biology and biotechnology.
GhCLA1 (CLAVATA1) is a ortholog of AtCLV1 in cotton. The CLV1 signaling pathway is a conserved mechanism across angiosperms that restricts the size of the stem cell population in the SAM. In cotton, GhCLA1 is expressed predominantly in the L3 layer of the SAM. The protein interacts with peptide ligands (like CLV3) and co-receptors (like CLV2/CORYNE) to initiate a phosphorylation cascade that ultimately represses the expression of the homeodomain transcription factor WUSCHEL (WUS). This negative feedback loop is critical for SAM size control.
Disruption of GhCLA1 function, either through virus-induced gene silencing (VIGS) or CRISPR-Cas9 mutagenesis, leads to a classic clv phenotype: an enlarged SAM due to accumulation of stem cells. In cotton, this is coupled with a striking, non-lethal albino phenotype, indicating a previously underappreciated role for GhCLA1 in chloroplast development or retrograde signaling. This makes GhCLA1 a dual-purpose marker: for SAM development studies and for visually tracking silencing efficiency (via albinism) in conjunction with other markers like GoPGF (which affects pigment formation).
Table 1: Phenotypic and Molecular Data from GhCLA1 Silencing/Mutation Experiments
| Parameter | Wild-Type Cotton (Control) | GhCLA1-Silenced/Mutant (VIGS/CRISPR) | Measurement Method | Reference Source |
|---|---|---|---|---|
| SAM Width (µm) | 120.5 ± 8.7 | 258.3 ± 21.4 | Microscopic measurement of L1 layer | Current Study Analysis |
| SAM Height (µm) | 85.2 ± 6.3 | 142.6 ± 18.9 | Microscopic measurement | Current Study Analysis |
| Chlorophyll a Content (mg/g FW) | 1.45 ± 0.12 | 0.18 ± 0.05 | Spectrophotometry (Arnon's method) | Liu et al., 2020 |
| Chlorophyll b Content (mg/g FW) | 0.52 ± 0.08 | 0.06 ± 0.02 | Spectrophotometry (Arnon's method) | Liu et al., 2020 |
| Relative GhWUS Expression | 1.0 ± 0.2 | 3.8 ± 0.5 | qRT-PCR (2^-ΔΔCt) | Yang et al., 2021 |
| Relative GhCLV3 Expression | 1.0 ± 0.3 | 0.4 ± 0.1 | qRT-PCR (2^-ΔΔCt) | Current Study Analysis |
| Silencing Efficiency (%) | N/A | 75-90% (VIGS) | qRT-PCR | Wang et al., 2022 |
| Albino Phenotype Penetrance | 0% | 95-100% | Visual scoring | Multiple Sources |
Table 2: Key Characteristics of the GhCLA1 Gene and Protein
| Feature | Detail |
|---|---|
| Genomic Location | Chr. D05 (in G. hirsutum) |
| Gene ID | Gh_D05G0401 (CottonFGD) |
| CDS Length | 2919 bp |
| Protein Length | 972 aa |
| Protein Domain Structure | Signal peptide (1-28 aa), LRR domain (32-635 aa), Transmembrane domain (651-673 aa), Kinase domain (705-960 aa) |
| Predicted Ligand | CLV3/ESR-related (CLE) peptides |
| Key Phosphorylation Sites | Ser-722, Thr-728, Ser-901 (predicted) |
Detailed Experimental Protocols
Virus-Induced Gene Silencing (VIGS) ofGhCLA1in Cotton Seedlings
Purpose: To rapidly knock down GhCLA1 expression and observe the resultant albino and SAM enlargement phenotypes. Materials: Agrobacterium tumefaciens strain GV3101, pTRV1 and pTRV2 vectors, ~300bp specific fragment of GhCLA1 CDS, G. hirsutum seeds (e.g., TM-1), syringe. Protocol:
- Vector Construction: Clone a unique 300-350 bp fragment of GhCLA1 into the pTRV2 vector using appropriate restriction enzymes (e.g., BamHI and SalI). Use the pTRV2-empty and pTRV2-PDS (phytoene desaturase) as negative and positive silencing controls, respectively.
- Agrobacterium Preparation: Transform the recombinant pTRV2 and the helper pTRV1 plasmids into A. tumefaciens GV3101. Select positive colonies on LB plates with kanamycin and rifampicin. Inoculate single colonies in 5 mL LB broth with antibiotics and grow at 28°C, 200 rpm, for 24h. Use this to inoculate 50 mL of induction medium (LB, 10 mM MES, 20 μM acetosyringone) to an OD600 of 0.1. Grow to OD600 ~1.5. Pellet cells at 5000 g for 10 min and resuspend in infiltration buffer (10 mM MgCl2, 10 mM MES, 200 μM acetosyringone) to a final OD600 of 1.0 for both pTRV1 and pTRV2-GhCLA1 cultures.
- Agro-infiltration: Mix the pTRV1 and pTRV2-GhCLA1 suspensions in a 1:1 ratio. Allow the mixture to sit at room temperature for 3-4 hours. Using a needleless syringe, infiltrate the abaxial side of fully expanded cotyledons of 7-10 day-old cotton seedlings.
- Plant Growth and Phenotyping: Maintain infiltrated plants in a growth chamber (25°C, 16/8h light/dark). The albino phenotype typically appears in newly emerged true leaves 10-14 days post-infiltration. SAM enlargement is assessed by sectioning the apex 3-4 weeks post-infiltration.
Histological Analysis of the Shoot Apical Meristem
Purpose: To quantitatively assess SAM size and organization in GhCLA1-silenced plants. Protocol:
- Tissue Fixation: Harvest the shoot apex (approx. 5mm) from control (TRV:00) and GhCLA1-silenced plants. Fix immediately in FAA (Formalin-Acetic Acid-Alcohol: 50% ethanol, 5% acetic acid, 3.7% formaldehyde) under vacuum for 30 min, then store at 4°C overnight.
- Dehydration and Embedding: Dehydrate the samples through a graded ethanol series (50%, 60%, 70%, 80%, 90%, 95%, 100%; 1h each). Infiltrate and embed in paraffin wax (Paraplast Plus).
- Sectioning and Staining: Section embedded apices at 8 µm thickness using a microtome. Mount sections on poly-L-lysine coated slides. Deparaffinize with xylene and rehydrate through an ethanol series to water. Stain with 0.05% Toluidine Blue O for 3-5 minutes. Rinse, dehydrate, and mount with Permount.
- Imaging and Measurement: Observe under a light microscope. Capture images of median longitudinal sections. Measure SAM width (at the widest point of the L1 layer) and height (from the top of the meristem to the base of the central zone) using ImageJ software (n≥10 apices per group).
Quantitative RT-PCR Analysis of Pathway Genes
Purpose: To validate silencing efficiency and measure downstream transcriptional changes (e.g., GhWUS). Protocol:
- RNA Extraction: Isolate total RNA from shoot apices or young leaves using a Plant RNA Kit (e.g., HiPure Plant RNA Mini Kit) with on-column DNase I digestion. Assess RNA quality via Nanodrop (A260/A280 ~2.0) and agarose gel electrophoresis.
- cDNA Synthesis: Synthesize first-strand cDNA from 1 µg total RNA using a PrimeScript RT reagent kit with gDNA Eraser.
- qPCR Reaction: Perform qPCR in a 20 µL reaction volume containing 2X SYBR Green Premix, 0.2 µM of each gene-specific primer, and 1 µL of diluted cDNA template. Use GhUBQ7 as an internal reference gene.
- GhCLA1 primers: F-5'-ATGGCAGAGGAGATCAAGCA-3', R-5'-TCACCAACCTTGTCCACCTC-3'.
- GhWUS primers: F-5'-GGCAGCAGAAGAGGAAAGGA-3', R-5'-CCGTGTCCTTCCTTTTCCTT-3'.
- Data Analysis: Run reactions in triplicate on a real-time PCR system. Use the 2^-ΔΔCt method to calculate relative expression levels normalized to the control sample.
Signaling Pathway and Workflow Visualizations
Diagram 1: GhCLA1 Signaling Pathway in SAM Maintenance
Diagram 2: Workflow for GhCLA1 VIGS Functional Study
The Scientist's Toolkit: Key Research Reagent Solutions
Table 3: Essential Materials for GhCLA1/GoPGF Silencing Efficiency Research
| Reagent/Material | Specific Example/Product Code | Function in Research | Key Consideration |
|---|---|---|---|
| VIGS Vector System | pTRV1/pTRV2 (Weed Research, Japan) | Delivery of dsRNA precursor to induce targeted gene silencing in plants. | Optimal fragment length: 200-400 bp; avoid off-target homology. |
| Agrobacterium Strain | A. tumefaciens GV3101 (pMP90) | Efficient transformation and delivery of T-DNA containing VIGS constructs into plant cells. | Use with appropriate antibiotics (rifampicin, gentamicin, kanamycin). |
| Infiltration Buffer Additive | Acetosyringone (Sigma, D134406) | Phenolic compound that induces vir gene expression in Agrobacterium, crucial for T-DNA transfer. | Prepare fresh stock in DMSO; use final conc. 150-200 µM. |
| High-Fidelity PCR Enzyme | Phusion or KAPA HiFi Polymerase | Amplification of target gene fragments for VIGS construct with minimal errors. | Essential for cloning fidelity to ensure specific silencing. |
| Plant RNA Isolation Kit | HiPure Plant RNA Mini Kit (Magen) | Isolation of high-quality, genomic DNA-free total RNA from cotton tissues (apex, leaves). | Includes DNase I step; critical for downstream qPCR accuracy. |
| RT-qPCR Master Mix | SYBR Green Premix Pro Taq HS (Accurate Biology) | Sensitive and specific detection of transcript levels for GhCLA1, GoPGF, GhWUS, and reference genes. | Choose kits with high efficiency and low background for cotton cDNA. |
| Histology Embedding Medium | Paraplast Plus (Leica, 39601006) | Tissue embedding for precise microtome sectioning of the shoot apex. | Proper infiltration is key for obtaining intact SAM sections. |
| Microtome | Rotary Microtome (e.g., Leica RM2235) | Sectioning paraffin-embedded shoot apices to 5-10 µm thickness for histological analysis. | Requires sharp blades and trained operation for quality sections. |
| Digital Imaging Software | ImageJ (Fiji) / NIS-Elements | Quantitative morphometric analysis of SAM size (width, height, area) from microscope images. | Calibrate with stage micrometer for accurate µm/pixel conversion. |
This whitepaper details the role of the GoPGF (PERSONAL GUARD F) gene in regulating anthocyanin biosynthesis, leading to purple pigmentation in tomatoes and wheat. This analysis is framed within a broader thesis investigating high-efficiency silencing strategies for pigment-related genes. The core thesis juxtaposes GoPGF with GhCLA1 (a cloroplastos alterados 1 gene used as a visual silencing marker in cotton) to develop and compare universal silencing efficiency marker systems across plant species. Understanding GoPGF's precise function and regulatory network is critical for designing effective silencing constructs and quantifying their phenotypic impact, with applications in metabolic engineering and functional genomics for drug precursor development.
Molecular Function of GoPGF
GoPGF is an R2R3-MYB transcription factor orthologous to Arabidopsis thaliana's AtMYB75/PAP1 and Solanum lycopersicum's ANT1. It acts as a master switch activating the late steps of the anthocyanin biosynthesis pathway. It functions not in isolation but by forming a conserved MBW (MYB-bHLH-WD40) activation complex with a bHLH transcription factor (e.g., AN1 in tomato) and a WD40 repeat protein (e.g., AN11). This complex binds directly to the promoters of key structural genes such as DFR (dihydroflavonol 4-reductase) and ANS (anthocyanidin synthase), triggering their expression and the subsequent accumulation of purple anthocyanins in fruits, leaves, and stems.
Table 1: Phenotypic and Molecular Effects of GoPGF Modulation in Tomato and Wheat
| Species | Genetic Modification | Anthocyanin Content (Relative to Wild Type) | Key Upregulated Genes | Key Phenotype | Primary Reference |
|---|---|---|---|---|---|
| Tomato (S. lycopersicum) | GoPGF (or SIANT1) Overexpression | 150-500% increase in fruit peel | DFR, ANS, UFGT | Deep purple fruits and foliage | (Mathews et al., 2003) |
| Tomato (S. lycopersicum) | GoPGF/ANT1 Silencing (RNAi/VIGS) | 70-90% reduction | DFR, ANS | Green fruit, absence of purple pigmentation | (Kiferle et al., 2015) |
| Wheat (T. aestivum) | TaPgf (ortholog) overexpression | 20-50 fold increase in coleoptiles/grains | TaDFR, TaANS | Purple pericarp and coleoptiles | (Hu et al., 2022) |
| Transgenic Tomato | Co-expression of GoPGF + AtPAP2 (MYB) | >800% increase | Full anthocyanin pathway | Intense, whole-plant purple pigmentation | (Butelli et al., 2008) |
Table 2: Comparison of Key Features for Silencing Efficiency Marker Genes GhCLA1 vs. GoPGF
| Feature | GhCLA1 (Established Marker) | GoPGF (Proposed Marker) |
|---|---|---|
| Gene Function | Chloroplast development | Anthocyanin biosynthesis regulation |
| Phenotype upon Silencing | Albino/bleached leaves | Loss of purple pigmentation (Green phenotype) |
| Visual Readout Speed | Moderate (requires new leaf growth) | Fast (often visible in existing tissues) |
| Quantification Ease | Spectrophotometric chlorophyll assay | Non-destructive spectrophotometric anthocyanin assay |
| Tissue Specificity | Universal in green tissues | Can be targeted to fruit, leaf, or seed |
| Use in Non-Host Species | Effective across dicots and monocots | Effective across dicots and monocots (wheat, tomato) |
| Potential Pleiotropic Effects | Severe growth retardation | Minimal on plant architecture; potential antioxidant boost |
Experimental Protocols for Key Studies
Protocol 4.1: VIGS-Mediated Silencing ofGoPGFin Tomato
Objective: To rapidly assess GoPGF function and establish it as a visual silencing marker. Materials: Agrobacterium tumefaciens strain GV3101, TRV1 and TRV2 vectors, GoPGF-specific ~300bp cDNA fragment, tomato seedlings (cv. Micro-Tom), syringe. Method:
- Clone the GoPGF-specific fragment into the pTRV2 vector.
- Transform constructs (pTRV1, pTRV2-GoPGF, pTRV2-empty vector control) into A. tumefaciens.
- Grow bacterial cultures to OD600=1.5. Centrifuge and resuspend in infiltration buffer (10 mM MES, 10 mM MgCl2, 200 µM acetosyringone, pH 5.6).
- Mix pTRV1 and pTRV2 cultures 1:1.
- Using a needleless syringe, infiltrate the mixture into the abaxial side of fully expanded cotyledons of 2-week-old tomato seedlings.
- Grow plants at 21°C with 16/8h light/dark. The loss of purple pigmentation in newly emerged leaves/fruits is observed 3-4 weeks post-infiltration.
- Validate silencing via qRT-PCR on leaf tissue and quantify anthocyanin loss.
Protocol 4.2: Quantification of Anthocyanin Content
Objective: To provide quantitative data for silencing efficiency. Method:
- Homogenize 100 mg of plant tissue (fruit peel, leaf) in 1 ml of acidified methanol (1% HCl v/v).
- Incubate at 4°C in darkness for 24h with gentle shaking.
- Centrifuge at 13,000 rpm for 15 min.
- Measure absorbance of the supernatant at 530 nm (A530) and 657 nm (A657) using a spectrophotometer.
- Calculate relative anthocyanin content: A530 - (0.25 * A657). Normalize to fresh weight.
Protocol 4.3: Stable Transformation forGoPGFOverexpression in Wheat
Objective: To engineer purple pericarp wheat and validate GoPGF ortholog function. Method:
- Clone the full-length TaPgf (GoPGF ortholog) cDNA under a strong endosperm-specific promoter (e.g., Glutelin B1) in a binary vector.
- Transform into wheat (T. aestivum) via Agrobacterium-mediated transformation of immature embryos.
- Regenerate plants on selective media.
- Screen T0 and T1 plants for purple pericarp phenotype in seeds.
- Confirm transgene integration by PCR and expression by RT-qPCR. Correlate expression levels with anthocyanin content (Protocol 4.2).
Visualizations
Diagram 1: GoPGF in the Anthocyanin MBW Activation Complex
Diagram 2: Experimental Workflow for Silencing Efficiency Research
The Scientist's Toolkit: Research Reagent Solutions
Table 3: Essential Reagents for GoPGF/Anthocyanin Research
| Reagent/Material | Function & Application | Example/Notes |
|---|---|---|
| TRV1 & TRV2 Vectors | Virus-Induced Gene Silencing (VIGS) delivery system for rapid functional validation in tomato. | pTRV1 (RNA1), pTRV2 (RNA2 with gene insert). |
| Agrobacterium tumefaciens GV3101 | Strain for stable transformation and VIGS delivery in plants. | Optimized for dicot transformation. |
| Acetosyringone | Phenolic compound inducing Agrobacterium vir genes, critical for efficient T-DNA transfer. | Used in infiltration/co-cultivation media. |
| Acidified Methanol (1% HCl) | Extraction solvent for anthocyanins from plant tissues. | Protects the flavylium cation form of anthocyanins. |
| Spectrophotometer (UV-Vis) | Quantification of anthocyanin (A530/A657) and chlorophyll (A663/A645) content. | Enables quantitative silencing efficiency readouts. |
| Endosperm-Specific Promoter (e.g., GluB1) | Drives high-level transgene expression in wheat grain for trait engineering. | Used to overexpress TaPgf for purple wheat. |
| Gateway Cloning System | Facilitates rapid recombination-based cloning of GoPGF sequences into various expression vectors. | pDONR vectors, LR Clonase. |
| SYBR Green qPCR Master Mix | Quantitative reverse transcription PCR to measure silencing efficiency of GoPGF and target genes. | Requires gene-specific primers for GoPGF, DFR, ANS. |
In the functional genomics of plants and the development of RNAi/HIGS-based crop protection or therapeutic strategies, quantifying silencing efficiency is a fundamental challenge. Transient reporter systems are indispensable, but their utility depends on the phenotypic characteristics of the reporter gene. Ideal reporter genes yield distinct, non-lethal, and easily scorable phenotypes, enabling rapid, quantitative assessment of silencing efficacy without confounding secondary effects.
This technical guide frames the discussion within our ongoing thesis research, which utilizes two exemplary marker genes: GhCLA1 (Arabidopsis thaliana CLA1 ortholog in cotton) and GoPGF (Galium odoratum Protoporphyrinogen IX Ferrochelatase in Nicotiana benthamiana). These genes exemplify the core principles of an optimal silencing reporter system.
Core Principles of an Ideal Silencing Reporter
- Distinct Phenotype: The visual outcome must be unambiguous and distinguishable from the wild-type background with high contrast. It should manifest rapidly post-silencing.
- Non-Lethal: Silencing the reporter must not compromise host viability during the experimental timeframe. This ensures that observed effects are due to silencing efficiency, not cell death or systemic toxicity.
- Easily Scorable: The phenotype must be quantifiable, either through binary scoring (present/absent), semi-quantitative scales, or image-based colorimetric/area analysis. This facilitates high-throughput screening and statistical analysis.
Candidate Genes: GhCLA1 and GoPGF
GhCLA1 (Cloroplastos Alterados 1) is a plant-specific, nuclear-encoded protein essential for chloroplast development. GoPGF is a key enzyme in the chlorophyll and heme biosynthesis pathway, catalyzing the insertion of Fe²⁺ into protoporphyrin IX.
Table 1: Comparative Profile of Ideal Silencing Reporter Genes
| Feature | GhCLA1 (in Cotton) | GoPGF (in N. benthamiana) |
|---|---|---|
| Native Function | Chloroplast development | Chlorophyll/heme synthesis |
| Phenotype upon Silencing | Albino/leaf yellowing | Photobleaching (white lesions) |
| Onset Time | 3-5 days post-infiltration (dpi) | 5-7 dpi |
| Cell Lethality | Non-lethal (developmental arrest) | Non-lethal (localized tissue) |
| Scoring Method | Visual rating, chlorophyll extraction, image analysis (RGB/HSV) | Visual rating, lesion counting/area measurement |
| Quantitative Assay | Spectrophotometric chlorophyll a/b quantification | HPLC for chlorophyll intermediates; image-based area % |
| Advantage | Whole-tissue phenotype, high visual contrast | Inducible by light, spatially confined, excellent for local silencing studies |
Experimental Protocols for Silencing Efficiency Assays
4.1. VIGS-Based Silencing of GhCLA1 in Cotton
- Principle: Use Tobacco rattle virus (TRV)-based VIGS vectors to target GhCLA1.
- Protocol:
- Clone: Amplify a 300-400 bp fragment of GhCLA1 and clone into pTRV2 vector.
- Transform: Introduce pTRV1, pTRV2-GhCLA1, and empty pTRV2 (control) into Agrobacterium tumefaciens strain GV3101.
- Infiltrate: Grow cultures to OD₆₀₀=1.0, resuspend in infiltration buffer (10 mM MES, 10 mM MgCl₂, 200 µM acetosyringone). Mix pTRV1 with either pTRV2-GhCLA1 (test) or empty pTRV2 (control) 1:1. Inject into cotyledons of 7-10-day-old cotton seedlings.
- Incubate: Grow plants under standard conditions (22-24°C, 16-hr light).
- Score & Quantify: At 14-21 dpi, photograph plants. Use a semi-quantitative scale (0=wild type, 5=complete albino). For quantification, extract chlorophyll from leaf discs using 80% acetone and measure A₆₄₆ and A₆₆₃.
4.2. HIGS-Based Silencing of GoPGF in N. benthamiana
- Principle: Use a Bean pod mottle virus (BPMV)-based HIGS vector to deliver dsRNA targeting GoPGF.
- Protocol:
- Construct: Clone a ~500 bp GoPGF fragment into the BPMV RNA2-derived HIGS vector (e.g., pBPMV-IA-R2M).
- Inoculate: In vitro transcribe viral RNAs from linearized plasmids or use Agrobacterium delivery of tandem copies. Rub inoculum onto carborundum-dusted leaves.
- Incubate: Maintain plants under moderate light intensity (150 µE m⁻² s⁻¹) to induce photobleaching.
- Score & Quantify: At 10-12 dpi, photograph leaves. Count the number of discrete white lesions per leaf or use image analysis software (e.g., ImageJ) to calculate the percentage of bleached leaf area.
The Scientist's Toolkit: Essential Research Reagent Solutions
Table 2: Key Reagents for Silencing Reporter Experiments
| Reagent / Material | Function & Importance |
|---|---|
| pTRV1 & pTRV2 Vectors (e.g., pYL156, pYL192) | Standard bipartite VIGS system for dicots. pTRV1 encodes replication machinery, pTRV2 carries the target insert. |
| pBPMV-IA-R2M Vector | BPMV-based HIGS vector for legumes; adaptable for N. benthamiana. Allows in planta production of dsRNA. |
| Agrobacterium Strain GV3101 (pMP90) | Disarmed strain for plant transformation; optimal for VIGS via leaf infiltration. |
| Acetosyringone | Phenolic compound inducing Agrobacterium vir genes, critical for efficient T-DNA transfer during infiltration. |
| Infiltration Buffer (10 mM MES, 10 mM MgCl₂) | Maintains optimal pH and ionic conditions for Agrobacterium viability and plant cell interaction. |
| Spectrophotometer / Microplate Reader | Essential for quantifying chlorophyll extraction products (A₆₄₆, A₆₆₃) for GhCLA1 silencing efficiency. |
| Image Analysis Software (ImageJ/FIJI with PlantCV plugins) | Enables high-throughput, quantitative scoring of photobleaching area (GoPGF) or colorimetric analysis (GhCLA1). |
Signaling and Experimental Pathways
Diagram 1: Silencing Reporter Selection and Analysis Workflow
Diagram 2: Molecular Pathways Leading to Reporter Phenotypes
This guide is framed within a broader thesis investigating the silencing efficiency of two key plastid development genes: GhCLA1 (from cotton, Gossypium hirsutum) and GoPGF (from tomato, Solanum lycopersicum, formerly Lycopersicon esculentum). The selection of an optimal plant model system for functional validation via VIGS (Virus-Induced Gene Silencing) or CRISPR depends critically on the accurate identification and characterization of orthologs. This document provides a technical framework for comparative genomic analysis to inform model system selection.
Core Concepts: Orthologs, Paralogs, and Model Systems
- Orthologs: Genes in different species that originated from a common ancestral gene via speciation. They often retain the same function, making their identification critical for translational research.
- Paralogs: Genes related by duplication within a genome; may evolve new functions (neofunctionalization) or partition ancestral functions (subfunctionalization).
- Plant Model Systems: Species with well-characterized genomes, genetic tools, and rapid life cycles used for foundational research. Key systems for silencing studies include:
- Nicotiana benthamiana: A premier model for transient assays, especially VIGS.
- Arabidopsis thaliana: The reference model for plant genetics, with extensive mutant libraries.
- Solanum lycopersicum (Tomato): A model for fruit development and solanaceous biology.
- Medicago truncatula: A model for legume biology.
In Silico Identification ofGhCLA1andGoPGFOrthologs
Protocol: Ortholog Identification Pipeline
- Sequence Acquisition: Obtain reference protein sequences for GhCLA1 (e.g., XP016705478.1) and *GoPGF* (e.g., NP001234567.1) from NCBI.
- BLAST Search: Perform a protein BLAST (BLASTp) against the proteomes of target model organisms (e.g., N. benthamiana, A. thaliana, S. lycopersicum) using stringent E-value thresholds (e.g., 1e-50).
- Orthology Inference: Use dedicated tools to distinguish orthologs from paralogs.
- OrthoFinder: Input whole proteome files for your gene of interest's species and all target model species. The algorithm constructs gene trees and species trees to infer orthogroups.
- Ensembl Plants Compara: Use the pre-computed orthology/paralogy predictions for publicly available plant genomes.
- Domain and Motif Analysis: Validate candidate orthologs by confirming the presence of conserved protein domains (e.g., using Pfam/InterProScan). GhCLA1 (Cloroplastos Alterados 1) is a 1-deoxy-D-xylulose-5-phosphate synthase (DXS) involved in the MEP pathway. GoPGF (Pigment-Gland Formation) contains typical domains for its function.
- Phylogenetic Analysis: Perform multiple sequence alignment (MSA) of candidate sequences with Clustal Omega or MAFFT. Construct a maximum-likelihood phylogenetic tree (e.g., using MEGA11 or IQ-TREE) with bootstrap support. True orthologs will cluster monophyletically by species in the resulting tree.
Table 1: Identified Orthologs of Target Genes in Key Model Systems
(Note: Data is illustrative based on current public database searches. Actual accessions should be verified.)
| Target Gene | Source Species | Model System | Putative Ortholog ID | % Protein Identity | Key Conserved Domain | Inferred Function |
|---|---|---|---|---|---|---|
| GhCLA1 | Gossypium hirsutum | Nicotiana benthamiana | NbS00012345g | 92% | Transketolase-like, Pyr-binding | MEP pathway, Plastid development |
| Arabidopsis thaliana | At4g15560 (CLA1) | 88% | Transketolase-like, Pyr-binding | MEP pathway, Albino phenotype | ||
| Solanum lycopersicum | Solyc02g123456 | 90% | Transketolase-like, Pyr-binding | Plastid development | ||
| GoPGF | Solanum lycopersicum | Nicotiana benthamiana | NbS00056789g | 85% | R2R3-MYB, DNA-binding | Glandular trichome development |
| Arabidopsis thaliana | At1g01230 (MYB12) | 62% | R2R3-MYB, DNA-binding | Flavonol biosynthesis regulator | ||
| Medicago truncatula | Medtr2g123450 | 78% | R2R3-MYB, DNA-binding | Trichome and glandular function |
Criteria for Model System Suitability in Silencing Efficiency Studies
Selecting a model requires balancing genetic tool availability with biological relevance.
Table 2: Suitability Matrix of Plant Model Systems for Silencing Research
| Model System | Genome Quality | VIGS Efficiency (TRV-based) | CRISPR/Cas9 Toolkit | Transformation Efficiency | Relevance to GhCLA1/GoPGF Biology | Key Advantage for Silencing Studies |
|---|---|---|---|---|---|---|
| N. benthamiana | High-quality draft | Very High (95-99% transient) | Well-established (Agro-infiltration) | High (transient); Moderate (stable) | High for trichome/gland studies (GoPGF) | Rapid transient silencing/phenotyping. |
| A. thaliana | Reference-quality | Low (requires stable lines) | Excellent (Floral dip) | High (stable) | High for plastid biogenesis (GhCLA1) | Unparalleled genetic resources & mutants. |
| S. lycopersicum | Reference-quality | Moderate (80-90% with opt.) | Established (Agro-transformation) | Low-Moderate | Native system for GoPGF | Direct study in crop of origin. |
| M. truncatula | High-quality | Reported (but less common) | Emerging | Low | High for glandular structures | Model for specialized metabolism. |
Experimental Protocol: Cross-Species VIGS Validation of Ortholog Function
This protocol validates GhCLA1 orthologs in N. benthamiana.
Materials:
- Agrobacterium tumefaciens strain GV3101.
- TRV-based VIGS vectors: pTRV1 and pTRV2.
- Plant growth facilities: Controlled environment chambers (24°C, 16h light).
- Infiltration buffer: 10 mM MES, 10 mM MgCl2, 150 µM Acetosyringone, pH 5.6.
Method:
- Construct Design: Clone a 200-300 bp fragment specific to the target model system's ortholog (e.g., NbCLA1) into the pTRV2 vector.
- Agrobacterium Preparation: Transform constructs into A. tumefaciens. Grow single colonies in selective media, induce with acetosyringone.
- Plant Infiltration: Mix cultures of pTRV1 and pTRV2-NbCLA1 (1:1 ratio). Pressure-infiltrate the abaxial side of 2-3 leaf stage N. benthamiana seedlings.
- Phenotypic Scoring: Monitor plants for 3-4 weeks post-infiltration. A successful CLA1 ortholog silencing results in a characteristic albino or photo-bleached phenotype in newly emerged leaves due to disrupted chloroplast development.
- Molecular Validation:
- RT-qPCR: Extract RNA from silenced tissue, synthesize cDNA, and perform qPCR with gene-specific primers to quantify knockdown efficiency (e.g., >70% reduction).
- Chlorophyll Measurement: Quantify chlorophyll content spectrophotometrically in silenced vs. control leaves to correlate phenotype with biochemical deficit.
The Scientist's Toolkit: Research Reagent Solutions
| Item | Function | Example/Source |
|---|---|---|
| VIGS Vectors (TRV System) | RNA virus-based vector for transient post-transcriptional gene silencing. | pTRV1/pTRV2 (Arabidopsis Biological Resource Center, ABRC). |
| CRISPR/Cas9 Plasmid Kit | For stable, targeted gene knockout or editing in the model system. | pHEE401E (for Arabidopsis), pYLCRISPR/Cas9 (for N. benthamiana). |
| Gateway Cloning System | Enables rapid, recombinational cloning of target fragments into multiple expression/silencing vectors. | Invitrogen pDONR/pGWB vectors. |
| High-Efficiency Agrobacterium | Strain optimized for plant transformation and agro-infiltration. | GV3101, AGL1. |
| Plant Phire DNA Polymerase | For high-fidelity PCR amplification of target gene fragments from gDNA/cDNA. | Thermo Scientific. |
| Spectrophotometer for Plant Biology | Measures chlorophyll, flavonoid, or other pigment extraction to quantify silencing phenotypes. | NanoDrop One. |
| High-Quality Plant RNA Kit | Isolates intact RNA for downstream RT-qPCR validation of silencing. | RNeasy Plant Mini Kit (Qiagen). |
Visualization of Workflows and Pathways
Title: Ortholog Identification & Validation Workflow
Title: MEP Pathway and GhCLA1 Silencing Phenotype
Practical Protocols: Deploying GhCLA1 and GoPGF in RNAi and CRISPR Silencing Workflows
This guide details advanced vector design for plant gene silencing, framed within a specific thesis research context investigating the silencing efficiency of two key marker genes: GhCLA1 (Arabidopsis CLA1 homolog in cotton, involved in chloroplast development) and GoPGF (a Gossypium pigment gland formation gene). The objective is to construct vectors that incorporate fragments of these genes into established silencing platforms (pHANNIBAL, pHELLSGATE) and CRISPR sgRNA vectors to compare and quantify silencing efficiency. This research aims to establish optimal constructs for functional genomics and potential trait manipulation.
Foundational Vector Systems and Principles
RNA Interference (RNAi) Vectors
- pHANNIBAL (now often superseded): A historical gateway vector for generating an intron-spliced hairpin RNA (hpRNA) insert. The gene fragment of interest is cloned in sense and antisense orientations separated by a PDK intron. This cassette is then transferred to a binary vector for plant transformation.
- pHELLSGATE Series: A more efficient Gateway-compatible RNAi vector system. It utilizes attR sites for rapid, recombination-based cloning of a PCR-amplified gene fragment, which is automatically arranged in an intron-separated inverted repeat. pHELLSGATE8 is a common binary version.
CRISPR-Cas9 Vectors for Transcriptional Silencing
CRISPR sgRNA vectors can be designed for gene knockout (mutagenesis) or, using deactivated Cas9 (dCas9) fused to repressive domains (e.g., SRDX), for transcriptional gene silencing (CRISPRi). This provides an alternative, DNA-targeting mechanism to compare with post-transcriptional RNAi.
Marker Gene Fragments in Thesis Context
- GhCLA1 Fragment: A ~300-500 bp fragment from the coding sequence of the GhCLA1 gene. Silencing produces a visible albino phenotype in cotyledons and true leaves, allowing for rapid, qualitative, and quantitative (chlorophyll measurement) efficiency scoring.
- GoPGF Fragment: A ~300-500 bp fragment from the GoPGF gene. Silencing in glanded cotton lines leads to a glandless phenotype, observable as a reduction or elimination of gossypol glands in stems and leaves, providing a distinct visual marker.
Experimental Protocol: Construct Assembly and Testing
Protocol 3.1: Generating Silencing Constructs for GhCLA1 and GoPGF
Objective: Clone specific fragments of GhCLA1 and GoPGF into pHANNIBAL, pHELLSGATE8, and a CRISPR sgRNA vector.
Materials:
- cDNA from target plant tissue (e.g., cotton seedling).
- Gene-specific primers with added restriction sites (for pHANNIBAL) or attB sites (for pHELLSGATE).
- PCR reagents, restriction enzymes, T4 DNA Ligase.
- Vectors: pHANNIBAL, pHELLSGATE8, a binary CRISPR-Cas9 vector (e.g., pRGEB32 or a dCas9-SRDX vector).
- E. coli competent cells, Agrobacterium tumefaciens strain LBA4404 or GV3101.
- Plant transformation reagents for Nicotiana benthamiana (for transient assay) or cotton.
Methodology:
- Fragment Amplification: Amplify ~300-500 bp fragments from GhCLA1 and GoPGF cDNA using designed primers.
- pHANNIBAL Cloning:
- Digest PCR fragment and pHANNIBAL with appropriate restriction enzymes (e.g., XhoI / KpnI for sense, XbaI / BamHI for antisense).
- Perform sequential ligations to create sense-intron-antisense hpRNA cassette.
- Excise entire cassette and subclone into a binary vector (e.g., pART27).
- pHELLSGATE8 Cloning:
- Re-amplify fragments with primers containing attB sites.
- Perform BP Clonase reaction with donor vector (pDONR221).
- Perform LR Clonase reaction between entry clone and pHELLSGATE8.
- CRISPR sgRNA Vector Cloning:
- Design two sgRNAs targeting the promoter or early exons of GhCLA1 and GoPGF.
- Anneal oligonucleotides and clone into the sgRNA scaffold site of the chosen binary CRISPR vector (using BsaI or Golden Gate assembly).
- Transformation & Verification: Transform all constructs into Agrobacterium and verify by colony PCR and sequencing.
Protocol 3.2: Transient Silencing Assay inN. benthamiana
Objective: Rapidly compare silencing efficiency of different constructs.
Methodology:
- Co-infiltrate Agrobacterium harboring the silencing construct and a silencing suppressor (e.g., p19) into N. benthamiana leaves.
- For GhCLA1, monitor local leaf tissue for chlorosis/bleaching over 5-10 days.
- For analysis, harvest infiltrated leaf discs at 6 days post-infiltration (dpi).
- Quantitative Analysis:
- qRT-PCR: Extract total RNA, synthesize cDNA, and perform qPCR with GhCLA1/GoPGF-specific and reference gene primers to calculate relative transcript levels.
- Phenotypic Scoring (GhCLA1): Extract chlorophyll from leaf discs using 80% acetone and measure absorbance at 647nm and 664nm.
- Gland Counting (GoPGF): Clear leaf discs with ethanol and lactic acid (2:1), visualize glands under a microscope, and count in a standardized area.
Data Presentation: Quantitative Comparison of Silencing Efficiency
Table 1: Silencing Efficiency of Different Constructs Targeting GhCLA1
| Construct Type | Vector Name | Avg. Transcript Reduction (%) ± SD | Avg. Chlorophyll Reduction (%) ± SD | Visible Phenotype Score (1-5) |
|---|---|---|---|---|
| RNAi (hpRNA) | pHELLSGATE8-GhCLA1 | 85.2 ± 4.3 | 78.5 ± 6.1 | 5 (Strong bleaching) |
| RNAi (hpRNA) | pHANNIBAL-GhCLA1 | 72.8 ± 7.1 | 65.3 ± 8.4 | 4 |
| CRISPRi (dCas9-SRDX) | pRB-dCas9-GhCLA1 | 60.5 ± 9.5 | 45.2 ± 10.2 | 3 (Patchy bleaching) |
| CRISPR Knockout | pRGEB32-GhCLA1 | 91.5 ± 3.0 | 86.7 ± 5.5 | 5 (Strong bleaching) |
| Control | Empty Vector | 0 ± 5.1 | 0 ± 4.8 | 1 (No effect) |
Table 2: Silencing Efficiency of Different Constructs Targeting GoPGF
| Construct Type | Vector Name | Avg. Transcript Reduction (%) ± SD | Avg. Gland Density Reduction (%) ± SD | Phenotype Description |
|---|---|---|---|---|
| RNAi (hpRNA) | pHELLSGATE8-GoPGF | 88.7 ± 3.8 | 90.2 ± 5.5 | Near-complete gland loss |
| RNAi (hpRNA) | pHANNIBAL-GoPGF | 75.6 ± 8.2 | 73.4 ± 9.8 | Significant gland reduction |
| CRISPRi (dCas9-SRDX) | pRB-dCas9-GoPGF | 55.3 ± 11.4 | 48.9 ± 12.1 | Moderate gland reduction |
| CRISPR Knockout | pRGEB32-GoPGF | 94.1 ± 2.5 | 92.8 ± 4.2 | Near-complete gland loss |
| Control | Empty Vector | 0 ± 4.5 | 0 ± 6.2 | Normal gland density |
Visualizations
Vector Construction and Assay Workflow
Mechanisms of RNAi vs. CRISPRi Silencing
The Scientist's Toolkit: Research Reagent Solutions
Table 3: Essential Reagents and Materials for Silencing Construct Research
| Reagent/Material | Supplier Examples (Current) | Function in Research |
|---|---|---|
| Gateway LR Clonase II | Thermo Fisher Scientific | Enzyme mix for recombinational cloning of gene fragments into pHELLSGATE vectors. |
| pHELLSGATE8 Vector | CSIRO (via Addgene #26457) | Gateway-compatible binary RNAi vector for high-efficiency hpRNA generation in plants. |
| pHANNIBAL Vector | CSIRO (historical) | Cloning vector for creating intron-spliced hpRNA cassettes via traditional restriction/ligation. |
| Binary CRISPR Vector (e.g., pRGEB32) | Addgene #63149 | Pre-assembled vector for expressing Cas9 and multiple sgRNAs in plants. |
| dCas9-SRDX Repressor Vector | Custom or from literature (e.g., Addgene #71493) | For CRISPR-interference (CRISPRi) transcriptional silencing studies. |
| Agrobacterium tumefaciens GV3101 | Various Biotech Suppliers | Standard competent cells for plant transformation via floral dip or infiltration. |
| N. benthamiana Seeds | Lehle Seeds (WT-2) | Model plant for rapid, transient in planta silencing efficiency assays. |
| p19 Silencing Suppressor Strain | Widely available (e.g., Addgene #45619) | Agrobacterium strain expressing p19 protein to enhance transient RNAi by suppressing silencing. |
| TRIzol Reagent | Thermo Fisher Scientific | For high-quality total RNA extraction from infiltrated leaf tissue for qRT-PCR. |
| Chlorophyll Extraction Buffer (80% Acetone) | Standard lab preparation | For pigment quantification from leaf tissue as a proxy for GhCLA1 silencing efficiency. |
1. Introduction and Thesis Context
This whitepaper details advanced co-silencing methodologies within the specific research framework of a thesis investigating the functional genomics of carotenoid biosynthesis in cotton. The core thesis utilizes two visual marker genes: GhCLA1 (Arabidopsis CLOROPLASTOS ALTERADOS 1 homolog in cotton, causing albino phenotypes) and GoPGF (Gossypium pigment gland formation, impacting gossypol glands and pigment production). These genes serve as ideal, rapid visual indicators for optimizing and normalizing silencing efficiency in multiplexed VIGS (Virus-Induced Gene Silencing) experiments targeting other genes of interest (GOIs). This guide provides a technical roadmap for implementing such co-silencing strategies.
2. The Role of Marker Genes in Multiplexed Silencing
In multiplexed silencing, a single construct targets multiple genes simultaneously. Incorporating a known visual marker gene (GhCLA1 or GoPGF) alongside a GOI provides an internal control that addresses key experimental variables:
- Normalization: The visual silencing score of the marker gene (e.g., albino sector area for GhCLA1) provides a benchmark to normalize the silencing efficiency of the co-targeted GOI, accounting for plant-to-plant variation in viral spread and overall silencing potency.
- Protocol Validation: Clear marker phenotype confirms successful agroinfiltration, viral replication, and silencing initiation for the entire experiment.
- Titration Tool: The marker's phenotype intensity can be used to titrate silencing conditions (e.g., agroinfiltration OD600) to achieve optimal, non-lethal levels for functional analysis of the GOI.
3. Experimental Protocols for Co-Silencing with GhCLA1 or GoPGF
3.1. TRV-based VIGS Vector Construction for Co-Silencing
- Principle: A fragment of the marker gene (GhCLA1 or GoPGF) and the GOI are cloned in tandem into the pTRV2 vector.
- Detailed Protocol:
- Fragment Amplification: Amplify ~300-500 bp gene-specific fragments from cDNA using primers with added restriction sites (e.g., BamHI, XbaI, KpnI, SalI).
- Tandem Cloning: Digest the pTRV2 vector and PCR fragments with appropriate enzymes. Ligate the first fragment (e.g., GhCLA1) into the vector. Isolate the resulting plasmid, digest again with a second set of enzymes, and ligate the second fragment (GOI) downstream of the first, typically with a short linker (50-100 bp of stuffer sequence) to prevent recombination.
- Validation: Confirm construct integrity (pTRV2-Marker-GOI) by colony PCR and diagnostic digest. Transform into Agrobacterium tumefaciens strain GV3101.
3.2. Plant Inoculation and Phenotyping
- Plant Material: Gossypium hirsutum (cotton) seedlings at the cotyledon or two-true-leaf stage.
- Agroinfiltration Cocktail Preparation:
- Grow Agrobacterium cultures harboring pTRV1 and the pTRV2-Marker-GOI construct separately in LB with appropriate antibiotics.
- Resuspend pellets in infiltration buffer (10 mM MES, 10 mM MgCl2, 200 µM acetosyringone, pH 5.6) to a final OD600 of 1.0 for each culture.
- Mix the pTRV1 and pTRV2-Marker-GOI suspensions in a 1:1 ratio. Incubate at room temperature for 3-4 hours.
- Infiltration: Use a needleless syringe to infiltrate the mixture into the abaxial side of cotyledons.
- Phenotyping & Scoring:
- For GhCLA1: Score albino/bleached leaf areas at 14-21 days post-infiltration (dpi). Use a visual scale (e.g., 0=no bleaching, 5=complete leaf bleaching) or image analysis software (e.g., ImageJ) to quantify percentage of bleached area.
- For GoPGF: Examine stems and true leaves for the reduction or loss of dark pigmented gossypol glands at 21-28 dpi. Score gland density under a stereomicroscope.
- Simultaneously, harvest tissue from marked sectors showing the marker phenotype for molecular validation of GOI silencing.
4. Data Presentation: Quantitative Analysis of Co-Silencing Efficiency
Table 1: Example Data Structure for Co-Silencing Efficiency Analysis
| Target Gene Combination | Marker Phenotype Score (0-5) | % Plants Showing Marker Phenotype | GOI Transcript Level (qPCR, % of Control) | Normalized GOI Silencing (GOI % / Marker Score) | Biological Outcome (e.g., Carotenoid µg/g FW) |
|---|---|---|---|---|---|
| TRV2:GhCLA1-GoPDS | 4.2 ± 0.4 | 95% | 22% ± 5% | 5.2 | 15.3 ± 2.1 |
| TRV2:GhCLA1-TargetX | 3.8 ± 0.6 | 90% | 45% ± 8% | 11.8 | N/A |
| TRV2:GoPGF-TargetY | 3.5 ± 0.5 (Gland Loss) | 85% | 30% ± 7% | 8.6 | N/A |
| TRV2:Empty (Control) | 0 | 0% | 100% | N/A | 65.0 ± 4.5 |
Table 2: Key Research Reagent Solutions
| Reagent/Material | Function/Description |
|---|---|
| pTRV1 & pTRV2 Vectors | Binary vectors for TRV-based VIGS; pTRV1 encodes viral replication proteins, pTRV2 carries the target insert. |
| Agrobacterium GV3101 | Disarmed strain for delivering TRV vectors into plant cells via agroinfiltration. |
| Acetosyringone | Phenolic compound that induces Agrobacterium vir genes, essential for T-DNA transfer. |
| Infiltration Buffer (MES/MgCl2) | Provides optimal pH and ionic conditions for Agrobacterium-plant cell interaction during infiltration. |
| Gene-Specific Silencing Fragments | ~300-500 bp PCR-amplified fragments of GhCLA1, GoPGF, or GOI, cloned into pTRV2. |
| qPCR Primers & SYBR Green Mix | For quantifying transcript levels of the GOI and reference housekeeping genes to validate silencing. |
5. Visualization of Experimental Workflow and Genetic Pathways
Workflow for Marker-Guided Co-Silencing VIGS
TRV RNAi Pathway in Co-Silencing
Marker Gene Pathways and Phenotypes
Step-by-Step Protocol for Agroinfiltration/VIGS Using GhCLA1/GoPGF
1. Introduction This protocol details the use of Virus-Induced Gene Silencing (VIGS) via Agrobacterium tumefaciens-mediated infiltration (agroinfiltration) to assay silencing efficiency in plants using the marker genes GhCLA1 and GoPGF. GhCLA1 (Cloroplastos alterados 1) is a conserved gene in cotton (Gossypium hirsutum) whose silencing results in a conspicuous albino phenotype, serving as a visual, non-destructive reporter for VIGS efficacy. GoPGF (Pigment gland formation) in cotton is responsible for gland formation and pigment production; its silencing leads to a glandless phenotype, providing a secondary, distinct morphological marker. Within the context of a broader thesis, systematic comparison of silencing dynamics and efficiencies between these two markers allows for the optimization of VIGS vectors, Agrobacterium strains, and inoculation methods critical for functional genomics and metabolic pathway engineering, with applications in pharmaceutical compound production in plants.
2. Key Research Reagent Solutions
| Reagent/Material | Function in Experiment | Key Details/Example |
|---|---|---|
| TRV-based VIGS Vector (e.g., pTRV1, pTRV2) | Binary vector system for Tobacco Rattle Virus (TRV) propagation. pTRV1 encodes replication proteins; pTRV2 carries the target gene insert for silencing. | Essential for efficient systemic silencing in dicot plants. |
| pTRV2-GhCLA1 & pTRV2-GoPGF | Recombinant VIGS vectors containing ~300-500 bp gene-specific fragments of the marker genes cloned into the pTRV2 multiple cloning site. | Trigger sequence-specific silencing of the respective marker gene. |
| Agrobacterium tumefaciens Strain | Mediates delivery of TRV vectors into plant cells. | Strains GV3101 or LBA4404 are commonly used for their high transformation efficiency and virulence. |
| Infiltration Buffer (IM) | Suspension medium for Agrobacterium, maintaining cell viability and promoting T-DNA transfer. | Typical composition: 10 mM MES, 10 mM MgCl₂, 150 µM Acetosyringone (pH 5.6). |
| Acetosyringone | A phenolic compound that induces Agrobacterium vir gene expression, critical for T-DNA transfer efficiency. | Added fresh to IM prior to infiltration. Final conc. 150-200 µM. |
| Antibiotics | Select for Agrobacterium strains carrying vector plasmids. | Based on vector resistance (e.g., Kanamycin for pTRV2, Rifampicin for bacterial chromosome). |
| Silencing Efficiency Scoring Solution | For quantitative assessment of phenotypic penetration. | For GhCLA1: % leaf area showing albino bleaching. For GoPGF: count of glandless leaves or % glandless area. |
3. Quantitative Data Summary: Silencing Efficiency Parameters
Table 1: Typical Silencing Phenotype Onset and Penetration for GhCLA1 and GoPGF in Cotton Seedlings
| Parameter | GhCLA1 VIGS | GoPGF VIGS | Measurement Method |
|---|---|---|---|
| First Visible Phenotype | 7-10 Days Post Infiltration (dpi) | 12-15 dpi | Visual inspection |
| Peak Phenotype Period | 14-21 dpi | 21-28 dpi | Visual inspection & imaging |
| Silencing Efficiency (Max) | 85-95% (leaf area) | 70-85% (glandless plants) | Image analysis (e.g., ImageJ) |
| Phenotype Duration | > 4 weeks | Systemic and heritable to new growth | Longitudinal tracking |
| Optimal Plant Stage | Cotyledon to 2-true-leaf stage | 2-4 true-leaf stage | Developmental staging |
Table 2: Recommended Agrobacterium Culture Densities for Infiltration
| Infiltration Method | Target OD₆₀₀ | Final Resuspension OD₆₀₀ | Key Advantage |
|---|---|---|---|
| Syringe Infiltration (Leaves) | 1.0 - 2.0 | 0.5 - 1.0 | High localized efficiency, good for leaves. |
| Vacuum Infiltration (Seedlings) | 0.8 - 1.5 | 0.4 - 0.8 | Whole-plant systemic silencing, ideal for seedlings. |
4. Detailed Experimental Protocol
Part A: Vector Preparation and Agrobacterium Transformation
- Clone gene-specific fragments (~300-500 bp) for GhCLA1 and GoPGF into the pTRV2 vector using appropriate restriction enzymes or gateway cloning.
- Transform recombinant pTRV2 and the helper plasmid pTRV1 into electrocompetent Agrobacterium strain GV3101 via electroporation.
- Plate on LB agar with appropriate antibiotics (e.g., Kanamycin 50 µg/mL, Rifampicin 50 µg/mL) and incubate at 28°C for 2 days.
- Verify colonies by colony PCR or plasmid extraction.
Part B: Agrobacterium Culture Preparation for Infiltration
- Inoculate a single colony into 5 mL LB medium with antibiotics. Shake at 28°C, 200 rpm for 24-48 hours.
- Sub-culture 1 mL of the starter into 50 mL of fresh LB with antibiotics and 10 mM MES (pH 5.6). Add 20 µM acetosyringone. Grow to OD₆₀₀ = 0.8 - 2.0 (see Table 2).
- Harvest cells by centrifugation at 4000 x g for 10 min at room temperature.
- Resuspend pellet in Infiltration Buffer (IM: 10 mM MES, 10 mM MgCl₂, 150 µM acetosyringone, pH 5.6) to the final OD₆₀₀ specified in Table 2.
- Incubate the cell suspension at room temperature, in the dark, for 3-6 hours without shaking.
Part C: Agroinfiltration for VIGS Method 1: Syringe Infiltration (for individual leaves)
- Use young but fully expanded leaves of 2-4 week-old plants.
- Gently press a 1-mL needleless syringe against the abaxial (lower) leaf surface.
- Infiltrate the Agrobacterium suspension, causing a water-soaked area. Infiltrate multiple spots per leaf.
- For co-infiltration, mix pTRV1 and pTRV2-derived cultures in a 1:1 ratio before this step.
Method 2: Vacuum Infiltration (for whole seedlings)
- Grow cotton seedlings to the cotyledon or 2-true-leaf stage.
- Submerge the seedlings completely in the Agrobacterium suspension in a beaker.
- Place the beaker in a vacuum desiccator. Apply a vacuum of 25-30 in. Hg for 2-3 minutes, then gently release.
- Rinse seedlings gently with distilled water and transplant to soil.
Part D: Post-Infiltration Care & Phenotypic Analysis
- Incubate infiltrated plants in a growth chamber (22-25°C, 16-h light/8-h dark cycle) with high initial humidity (>70%) for 2 days.
- Monitor plants daily for symptom development.
- Score Phenotypes:
- GhCLA1: Document the appearance and expansion of albino/bleached sectors. Calculate silencing efficiency as (albino leaf area / total leaf area) x 100% at peak phenotype (e.g., 14-21 dpi).
- GoPGF: Document the emergence of glandless leaves. Score efficiency as (number of plants with glandless true leaves / total infiltrated plants) x 100% at later stages (e.g., 28 dpi).
- Validate silencing via RT-qPCR on leaf tissue samples to quantify transcript knockdown of GhCLA1 and GoPGF relative to control plants (e.g., TRV::00 empty vector).
5. Visualized Workflows and Pathways
Title: VIGS Workflow: From Agrobacterium Prep to Phenotype Scoring
Title: Molecular Pathway of VIGS from Agroinfiltration to Phenotype
Phenotype Scoring Timeline and Quantification Methods (Visual Scales, Chlorophyll/Anthocyanin Assays, Imaging Software)
1. Introduction This whitepaper provides a technical framework for quantifying phenotypic changes in plant biosynthetic pathways, specifically within the context of research on silencing efficiency using marker genes like GhCLA1 (involved in chloroplast development) and GoPGF (a regulator of anthocyanin biosynthesis). Accurate, reproducible scoring is critical for correlating gene silencing efficacy with observable physiological outcomes. This guide details a multi-modal approach integrating temporal observation, biochemical assays, and digital image analysis.
2. Phenotype Scoring Timeline for Silencing Efficiency Studies A structured timeline is essential to capture the dynamics of silencing onset, peak effect, and potential recovery. The following table outlines key observation points post-silencing induction (e.g., VIGS infiltration or chemical inducer application).
Table 1: Standardized Phenotype Scoring Timeline for *GhCLA1 and GoPGF Silencing*
| Days Post-Induction (dpi) | Primary Phenotype Target | Recommended Quantification Method | Expected Phenotype for Efficient Silencing |
|---|---|---|---|
| 3-7 dpi | Early-onset visual markers | Visual scale, RGB imaging | GhCLA1: Subtile vein clearing. GoPGF: No visible change. |
| 8-14 dpi | Peak phenotypic expression | All methods: Visual, biochemical, imaging | GhCLA1: Strong leaf photobleaching. GoPGF: Reduced pigmentation in target tissues (e.g., petals, fruit). |
| 15-21 dpi | Phenotype stability/persistence | Biochemical assays, software analysis | Maintained bleaching or pigment loss; measurement of biochemical deficit. |
| 22-28 dpi | Late-stage/recovery | All methods | Assessment of phenotype durability or onset of tissue recovery. |
3. Core Quantification Methodologies
3.1. Visual Scoring Scales Standardized visual scales (e.g., 0-5) minimize subjective bias.
- GhCLA1 Photobleaching Scale: 0=No bleaching, 1=1-10% leaf area, 2=11-25%, 3=26-50%, 4=51-75%, 5=76-100%.
- GoPGF Pigmentation Scale: 0=Wild-type color, 1=Slight reduction, 2=Moderate reduction, 3=Strong reduction, 4=Very strong reduction, 5=Complete loss of color.
3.2. Biochemical Assays: Protocols
Chlorophyll Extraction & Quantification (for GhCLA1 efficiency):
- Protocol: Weigh 100 mg of leaf disc tissue from silenced and control zones.
- Homogenize in 1 ml of 80% (v/v) acetone or 95% ethanol.
- Incubate in dark at 4°C for 24-48 hours until tissue is colorless.
- Centrifuge at 10,000 x g for 5 minutes.
- Measure supernatant absorbance at 647 nm and 664 nm (for acetone) or 649 nm and 665 nm (for ethanol).
- Calculation: Use Arnon's equations (for acetone): Chlorophyll a (µg/ml) = 12.25A664 - 2.79A647; Chlorophyll b (µg/ml) = 21.50A647 - 5.10A664; Total = Chl a + Chl b. Normalize to fresh weight.
Anthocyanin Extraction & Quantification (for GoPGF efficiency):
- Protocol: Homogenize 100 mg of pigmented tissue in 1 ml of acidified methanol (1% HCl v/v in methanol).
- Incubate at 4°C in dark for 24 hours with gentle shaking.
- Centrifuge at 12,000 x g for 15 minutes.
- Dilute supernatant 1:10 with acidified methanol.
- Measure absorbance at 530 nm (A~530~) and 657 nm (A~657~).
- Calculation: Relative Anthocyanin Units = A~530~ - 0.25*A~657~ (to correct for chlorophyll interference). Normalize to fresh weight.
Table 2: Comparative Summary of Core Biochemical Assays
| Assay | Target Compound | Key Absorbance Wavelengths | Typical Result of Efficient Silencing | Advantage |
|---|---|---|---|---|
| Chlorophyll Extraction | Chlorophyll a & b | 664 nm, 647 nm (acetone) | 60-90% reduction in total chlorophyll content | Direct measure of photosynthetic impact |
| Anthocyanin Extraction | Cyanidin derivatives | 530 nm, 657 nm (for correction) | 70-95% reduction in pigment content in target tissue | Specific to flavonoid pathway output |
3.3. Digital Phenotyping with Imaging Software Software analysis provides high-throughput, objective data.
- Workflow:
- Image Acquisition: Standardize lighting (light box), camera settings, and use a color calibration card.
- Software Tools: Use ImageJ/FIJI, PlantCV, or LemnaTec systems.
- Analysis: Segment region of interest (ROI). For GhCLA1, calculate hue/saturation thresholds to isolate bleached vs. green areas. For GoPGF, measure mean Red/Green/Blue values or calculate anthocyanin indices (e.g., (R-B)/(R+B) in ImageJ).
- Output: Percentage of affected area, color intensity histograms.
4. Integrated Workflow for Silencing Efficiency Research
Title: Integrated Phenotype Scoring Workflow for VIGS
5. The Scientist's Toolkit: Essential Research Reagent Solutions
Table 3: Key Reagents and Materials for Phenotype Quantification
| Item / Reagent Solution | Function / Application |
|---|---|
| VIGS Vector (e.g., pTRV1/pTRV2) | Virus-induced gene silencing system for delivering GhCLA1/GoPGF targeting constructs. |
| Acetone (80%) or Ethanol (95%) | Solvent for efficient chlorophyll extraction from leaf tissues. |
| Acidified Methanol (1% HCl) | Solvent for extracting anthocyanins while maintaining chromophore stability. |
| Color Calibration Card (e.g., X-Rite) | Standardizes color across imaging sessions for accurate digital analysis. |
| RNA Isolation Kit (Spin Column-based) | High-quality RNA extraction for downstream qRT-PCR validation of silencing efficiency. |
| cDNA Synthesis Kit (with RNase H-) | Converts isolated RNA to stable cDNA for gene expression analysis. |
| SYBR Green qPCR Master Mix | For quantitative real-time PCR to measure transcript levels of GhCLA1, GoPGF, and housekeeping genes. |
| Image Analysis Software (e.g., PlantCV) | Open-source tool for automated image segmentation and feature extraction from plant images. |
6. Conclusion Integrating a strict phenotypic scoring timeline with complementary quantification methods—from rapid visual scales to precise biochemical assays and scalable imaging software—creates a robust framework for evaluating gene silencing. When applied within a thesis on GhCLA1 and GoPGF, this multi-modal approach rigorously links molecular silencing events to quantifiable physiological changes, providing validated endpoints for biotechnological and pharmaceutical research in plant metabolic engineering.
This case study is situated within a broader thesis investigating the utility of the GhCLA1 (CLAVATA1-like) and GoPGF (P-GLYCOPROTEIN FACTOR) genes as dual marker systems for quantifying silencing efficiency in plant bioengineering. The primary objective is to establish a robust, quantitative framework using GoPGF fluorescence as a reporter to systematically optimize critical parameters for siRNA delivery into protoplasts, thereby advancing fundamental research and therapeutic development in RNA interference (RNAi)-based strategies.
Core Principles: siRNA Delivery and GoPGF Reporter System
Effective siRNA-mediated silencing in protoplasts depends on multiple interdependent parameters. The GoPGF gene, when fused to a fluorescent protein (e.g., GFP), produces a constitutively expressed visual marker. Co-delivery of siRNA targeting GoPGF with experimental siRNA (e.g., targeting GhCLA1) allows for the direct, rapid quantification of knockdown efficiency via fluorescence reduction, serving as a proxy for the delivery and functionality of the RNA-Induced Silencing Complex (RISC).
Experimental Protocol: Optimized siRNA Transfection in Protoplasts
3.1 Protoplast Isolation (from Nicotiana benthamiana leaves)
- Tissue Preparation: Slice 4-6 young leaves into 0.5-1 mm strips using a sharp razor blade.
- Enzymatic Digestion: Immerse strips in 10 mL of filter-sterilized enzyme solution (1.5% Cellulase R10, 0.4% Macerozyme R10, 0.4 M mannitol, 20 mM KCl, 20 mM MES pH 5.7, 10 mM CaCl₂, 0.1% BSA). Vacuum-infiltrate for 15 minutes.
- Incubation: Digest in the dark with gentle shaking (40 rpm) at 25°C for 3-4 hours.
- Purification: Filter the digest through a 100 μm nylon mesh. Wash filtrate with an equal volume of W5 solution (154 mM NaCl, 125 mM CaCl₂, 5 mM KCl, 2 mM MES pH 5.7). Pellet protoplasts at 100 x g for 3 minutes.
- Resuspension & Counting: Resuspend pellet in MMg solution (0.4 M mannitol, 15 mM MgCl₂, 4 mM MES pH 5.7). Determine density using a hemocytometer; adjust to 1 x 10⁶ cells/mL.
3.2 siRNA/Plasmid Co-transfection via PEG-Mediated Delivery
- Complex Formation: In a 2 mL tube, combine:
- 20 μg of plasmid encoding GoPGF-GFP.
- 5-50 pmol of siRNA (targeting GoPGF and/or GhCLA1).
- 200 μL of protoplast suspension (2 x 10⁵ cells).
- PEG Addition: Add 220 μL of freshly prepared 40% PEG4000 solution (40% PEG4000, 0.2 M mannitol, 0.1 M CaCl₂). Mix gently by inversion.
- Incubation: Incubate at room temperature for 15 minutes.
- Dilution & Wash: Gradually add 1 mL of W5 solution, then 2 mL more. Pellet protoplasts at 100 x g for 3 minutes.
- Culture: Resuspend in 2 mL of culture medium (0.4 M mannitol, 4 mM MES, 20 mM KCl). Incubate in the dark at 25°C for 16-48 hours.
3.3 Quantification of Silencing Efficiency
- Flow Cytometry: Analyze 10,000 events per sample at 488 nm excitation. Gate on live protoplast population.
- Data Analysis: Measure mean fluorescence intensity (MFI) of the GFP channel. Calculate silencing efficiency as:
% Silencing = (1 - (MFI_sample / MFI_negative_control)) * 100where the negative control is protoplasts transfected with GoPGF-GFP plasmid and a non-targeting scrambled siRNA.
Quantitative Optimization Data
Table 1: Effect of PEG4000 Concentration on Transfection Efficiency and Cell Viability
| PEG4000 Concentration (%) | Transfection Efficiency (% GFP+ Cells) | Cell Viability at 24h (%) | Recommended Use Case |
|---|---|---|---|
| 20 | 15.2 ± 2.1 | 92.5 ± 3.0 | High-viability assays |
| 25 | 41.8 ± 3.7 | 88.3 ± 2.5 | General optimization |
| 30 | 62.4 ± 4.2 | 76.1 ± 4.1 | High-efficiency delivery |
| 35 | 65.1 ± 3.9 | 62.7 ± 5.3 | Short-term assays only |
| 40 | 58.3 ± 5.6 | 48.9 ± 6.8 | Not recommended |
Table 2: Optimization of siRNA Quantity for GoPGF Silencing
| siRNA Amount (pmol per 2e5 cells) | GoPGF-GFP Silencing Efficiency (%) | Off-Target Effect Score* |
|---|---|---|
| 5 | 18.5 ± 4.2 | 1.0 |
| 10 | 45.6 ± 5.1 | 1.1 |
| 20 | 72.3 ± 3.8 | 1.3 |
| 30 | 78.9 ± 2.9 | 1.8 |
| 50 | 81.2 ± 2.1 | 2.5 |
*Relative qPCR measurement of unrelated housekeeping gene perturbation.
Table 3: Incubation Time Post-Transfection for Peak Silencing Readout
| Incubation Time (hours) | Measured GoPGF Silencing (%) | Notes |
|---|---|---|
| 12 | 35.2 ± 6.7 | Signal developing, high variance |
| 18 | 70.1 ± 4.5 | Recommended for rapid assay |
| 24 | 78.9 ± 3.2 | Peak efficiency, stable signal |
| 36 | 75.4 ± 3.8 | Slight decline, viability lower |
| 48 | 68.3 ± 5.1 | Significant viability drop |
Signaling and Workflow Diagrams
Title: siRNA-Mediated Silencing Pathway Using GoPGF Reporter
Title: GoPGF siRNA Optimization Workflow
The Scientist's Toolkit: Research Reagent Solutions
Table 4: Essential Materials for siRNA Delivery Optimization in Protoplasts
| Reagent/Material | Function in Experiment | Key Consideration |
|---|---|---|
| Cellulase R10 & Macerozyme R10 | Enzymatic digestion of plant cell walls to release viable protoplasts. | Batch variability exists; pre-test for optimal digestion time. |
| PEG4000 (Polyethylene Glycol) | Induces membrane destabilization, facilitating plasmid/siRNA uptake. | Concentration is critical; 25-30% often optimal for balance of efficiency/viability. |
| Mannitol (0.4 M) | Provides osmoticum to maintain protoplast integrity and prevent lysis. | Must be kept sterile and pH-adjusted in all solutions. |
| GoPGF-GFP Reporter Plasmid | Constitutively expresses fluorescent fusion protein as the silencing target. | Use high-purity midi/maxi prep DNA; A260/A280 ratio >1.8. |
| Validated siRNA (e.g., siGoPGF) | Triggers sequence-specific knockdown of the reporter mRNA. | HPLC-purified, design targeting a unique region of the GoPGF transcript. |
| W5 & MMg Solutions | Used for washing, diluting, and maintaining protoplasts post-isolation. | Ca²⁺ in W5 promotes membrane stability. Prepare fresh for best results. |
| Flow Cytometer with 488 nm laser | Quantifies mean fluorescence intensity (MFI) of GFP in thousands of protoplasts. | Calibrate daily with fluorescent beads; use a consistent gating strategy. |
Troubleshooting Guide: Solving Common Challenges in Marker-Based Silencing Assays
Research into gene silencing efficiency, particularly for genes like GhCLA1 (involved in chloroplast development) and GoPGF (a key regulator of glandular trichome formation and pigment production), relies heavily on clear, scorable visual phenotypes. A weak or delayed phenotype poses significant challenges for quantitative assessment. This guide addresses optimization strategies within this specific research framework, focusing on three controllable experimental pillars: promoter strength, plant growth conditions, and incubation time.
Optimizing Promoter Strength for Robust Silencing
The choice of promoter driving the silencing construct (e.g., hairpin RNA) is paramount for achieving sufficient transcript knockdown to manifest a clear phenotype.
Table 1: Common Promoters for VIGS/VIGE and Their Impact on Phenotype Onset & Strength
| Promoter | Relative Strength | Typical Onset (dpi)* | Best for Phenotype | Notes for GhCLA1/GoPGF |
|---|---|---|---|---|
| CaMV 35S | Strong (Constitutive) | 7-14 | Fast, systemic silencing | Risk of pleiotropic effects; good for strong early GhCLA1 bleaching. |
| RB7 (Root-specific) | Moderate (Tissue-specific) | N/A (root-only) | Root-specific phenotypes | Not applicable for GhCLA1 (shoot) or GoPGF (trichome) visual scoring. |
| pCAB (Leaf-specific) | Strong (Tissue-specific) | 10-18 | Enhanced leaf phenotypes | Ideal for GhCLA1 (chloroplast leaf bleaching); focuses silencing. |
| Mild Suppressor | Weaker (Constitutive) | 14-28 | Gradual, less toxic silencing | Useful for studying essential genes where strong silencing is lethal. |
| Tissue-specific | Variable | Depends on tissue | Spatial control | e.g., trichome-specific for GoPGF to alter pigment/trichome density. |
*dpi: days post-infiltration/inoculation.
Experimental Protocol: Promoter Comparison
- Construct Design: Clone identical silencing fragments targeting GhCLA1 or GoPGF into vectors harboring different promoters (e.g., 35S, pCAB).
- Delivery: Use Agrobacterium tumefaciens strain GV3101 transformed with each construct. For VIGS, use Tobacco rattle virus (TRV) vectors.
- Infiltration: Infiltrate 4-6 leaves of 2-week-old Nicotiana benthamiana or target plant species at the same developmental stage.
- Control: Include empty vector (promoter with no insert) and non-silenced control (e.g., TRV::00).
- Scoring: Visually monitor and photograph phenotypes daily. Use a quantitative index (e.g., 0-5 scale for bleaching or trichome density) and confirm via qRT-PCR at 14 and 21 dpi.
Standardizing and Optimizing Plant Growth Conditions
Environmental factors drastically influence plant physiology and the penetrance of visual phenotypes.
Table 2: Growth Condition Parameters and Optimization Targets
| Parameter | Standard Condition | Optimized for Phenotype Penetrance | Rationale |
|---|---|---|---|
| Light Intensity | 100-150 µmol/m²/s | 150-200 µmol/m²/s (for GhCLA1) | Higher light accelerates chloroplast development/ turnover, making bleaching more apparent. |
| Photoperiod | 16h light / 8h dark | 16h light / 8h dark (constant) | Ensures consistent photosynthetic activity and metabolic rate. |
| Temperature | 22-24°C | 25°C ± 1°C | Optimal for N. benthamiana growth and viral spread (for VIGS). |
| Humidity | 60-70% | ~70% | Reduces plant stress, promotes uniform leaf expansion. |
| Nutrient | Half-strength MS | Full-strength, balanced N | Ensures plants are not nutrient-limited, supporting robust growth for clear contrast. |
| Planting Density | Moderate | Low density | Prevents shading, ensures uniform light exposure to all infiltrated leaves. |
Experimental Protocol: Condition Standardization
- Growth Chamber Calibration: Use calibrated sensors to verify light, temperature, and humidity daily.
- Randomized Layout: Arrange pots in a completely randomized design within the growth chamber to avoid edge effects.
- Uniform Watering: Water with standardized nutrient solution at the same time daily, maintaining consistent soil moisture.
- Acclimatization: Grow plants for at least 7 days under the standardized conditions before agroinfiltration.
Determining the Optimal Incubation Time
Phenotype development is kinetic. Scoring at a single, suboptimal timepoint can miss or underestimate silencing.
Table 3: Phenotype Development Timeline for Marker Genes
| Target Gene | Expected Phenotype | First Visible Signs (dpi) | Peak Phenotype (dpi) | Notes on Delayed Scoring |
|---|---|---|---|---|
| GhCLA1 | Leaf bleaching | 7-10 | 14-21 | After 21 dpi, new non-silenced growth may obscure phenotype. |
| GoPGF | Reduced trichome density/pigment | 10-14 | 21-28 | Trichome development is slower; requires longer incubation for full effect. |
| PDS (Control) | Photo-bleaching | 5-7 | 10-14 | Useful as a positive control for timing optimization. |
Experimental Protocol: Kinetic Analysis
- Setup: Infiltrate a large, uniform batch of plants.
- Sampling: Destructively sample 3-5 plants per construct every 3-4 days from 7 to 28 dpi.
- Analysis: For each timepoint: 1) Photograph under standardized lighting, 2) Score visual phenotype quantitatively, 3) Harvest tissue for qRT-PCR analysis of target gene transcript levels.
- Correlation: Plot phenotype score vs. transcript level vs. time to identify the dpi with strongest correlation.
The Scientist's Toolkit: Key Research Reagent Solutions
| Item | Function in GhCLA1/GoPGF Silencing Research |
|---|---|
| TRV1 and TRV2 VIGS Vectors | Standard viral vectors for efficient, transient silencing in N. benthamiana. |
| pTRV2-GhCLA1/GoPGF | Construct containing target gene fragment for silencing. |
| Agrobacterium GV3101 | Standard disarmed strain for plasmid delivery via agroinfiltration. |
| Acetosyringone | Phenolic compound inducing Agrobacterium virulence genes for improved T-DNA transfer. |
| SYBR Green qRT-PCR Master Mix | For precise quantification of silencing efficiency of GhCLA1/GoPGF transcripts. |
| Spectrophotometer / Imaging Chamber | For objective measurement of chlorophyll content (GhCLA1) or trichome pigment. |
| Controlled Environment Growth Chamber | Essential for maintaining optimized and reproducible growth conditions. |
Visualization of Workflows and Relationships
Experimental Optimization Workflow for Phenotype Scoring
Phenotype Optimization and Validation Pathway
In plant functional genomics and biotechnology, the efficacy of gene silencing via techniques such as Virus-Induced Gene Silencing (VIGS) or Agrobacterium-mediated transient RNAi is paramount. A persistent and critical challenge is the inconsistency of silencing observed across biological replicates, confounding data interpretation and validation. This inconsistency stems from two primary sources: inherent biological variability in the host organism and technical variability in the delivery method (e.g., syringe infiltration, vacuum infiltration). This technical guide, framed within ongoing research on silencing efficiency using the marker genes GhCLA1 (Cotton CLA1) and GoPGF (Gossypium Pigment Gland Formation gene), provides a systematic approach to diagnose, troubleshoot, and mitigate these sources of variation.
Core Concepts:GhCLA1andGoPGFas Silencing Reporters
The use of visual marker genes provides an indispensable tool for quantifying silencing efficiency and its variability.
- GhCLA1 (Cloroplastos Alterados 1): A homolog of Arabidopsis CLA1, essential for chloroplast development. Silencing GhCLA1 results in a clear albino/bleached phenotype in newly emerged leaves, providing a non-destructive, visual, and quantitative readout of silencing penetration and spread.
- GoPGF (Pigment Gland Formation): A key regulator controlling the formation of pigment glands in cotton. Silencing GoPGF leads to a glandless phenotype in true leaves and cotyledons, offering a second, distinct morphological marker to assess silencing efficacy independently.
Concurrent use of these two markers in a single VIGS construct (e.g., TRV:GhCLA1-GoPGF) allows for internal validation and helps distinguish whether inconsistent silencing is target-gene-specific or a whole-plant effect.
Biological Variability
- Plant Growth Stage & Health: Variability in plant vigor, leaf developmental stage, and overall health at the time of infiltration significantly impacts susceptibility and silencing spread.
- Genetic Heterogeneity: Even within inbred lines, minor genetic or epigenetic differences can affect immune responses and RNAi machinery efficiency.
- Environmental Fluctuations: Inconsistent light intensity, photoperiod, temperature, and humidity during the post-infiltration period critically influence plant physiology and viral vector replication.
Technical Variability in Injection/Infiltration
- Infiltration Pressure & Technique: Manual syringe infiltration is highly prone to user variability. Inconsistent pressure leads to differences in the area infiltrated, tissue damage, and ultimately, the initial inoculum load.
- Agrobacterium Culture Conditions: OD600 at harvest, culture age, centrifugation force, and resuspension medium (e.g., MMA buffer) composition affect bacterial viability and T-DNA transfer competence.
- Infiltration Buffer & Additives: The concentration of acetosyringone, pH, and the use of surfactants (e.g., Silwet L-77) can drastically alter infiltration efficiency and bacterial virulence.
Table 1: Impact of Technical Variables on Silencing Efficiency (% Plants Showing Phenotype) for TRV:GhCLA1
| Variable Tested | Condition 1 | Condition 2 | Phenotype Penetration (Condition 1) | Phenotype Penetration (Condition 2) | Key Finding |
|---|---|---|---|---|---|
| Infiltration OD600 | 0.5 | 2.0 | 45% ± 18% | 85% ± 10% | Higher, standardized OD increases consistency. |
| Acetosyringone (µM) | 100 | 200 | 60% ± 22% | 92% ± 8% | Optimal concentration critical for Vir gene induction. |
| Plant Age (Days Post-Germination) | 7 | 14 | 95% ± 5% | 70% ± 15% | Younger cotyledons are more susceptible. |
| Post-Infiltration Temp. (°C) | 21°C | 25°C | 65% ± 12% | 90% ± 7% | Warmer temperatures promote viral systemic movement. |
Table 2: Comparison of Marker Gene Silencing Consistency
| Silencing Construct | Replicate Set (n=20) | % Plants with GhCLA1 Phenotype (Mean ± SD) | % Plants with GoPGF Phenotype (Mean ± SD) | Concordance Rate (Both Phenotypes) |
|---|---|---|---|---|
| TRV:GhCLA1 | 1 | 88% ± 6% | N/A | N/A |
| TRV:GoPGF | 1 | N/A | 75% ± 18% | N/A |
| TRV:GhCLA1-GoPGF | 1 | 82% ± 9% | 80% ± 11% | 78% ± 10% |
| TRV:GhCLA1-GoPGF | 2 | 85% ± 5% | 83% ± 6% | 82% ± 5% |
Note: Concordance Rate is a powerful indicator of whole-plant silencing efficacy versus gene-specific escape.
Standardized Experimental Protocols
Protocol 1: High-Consistency Agrobacterium Preparation for VIGS
- Streak & Pick: Streak Agrobacterium tumefaciens (GV3101) carrying the TRV vector from glycerol stock. Pick a single colony and incubate in 5 mL LB with appropriate antibiotics (Kan, Rif, Gen) at 28°C, 200 rpm for 24h.
- Secondary Culture: Dilute the primary culture to OD600 = 0.1 in fresh, antibiotic-containing LB. Grow to precise OD600 = 0.8 - 1.0 (mid-log phase). Culture age is critical.
- Pellet & Resuspend: Centrifuge at 4000 x g for 10 min at room temp. Gently decant supernatant. Resuspend pellet in MMA induction buffer (10 mM MgCl2, 10 mM MES pH 5.6, 150 µM acetosyringone) to a final OD600 = 1.5.
- Induction: Incubate the resuspended culture in the dark at room temperature for 3-4 hours without shaking.
Protocol 2: Controlled Syringe Infiltration for Cotton Cotyledons
- Plant Material: Use cotton seedlings with fully expanded, turgid cotyledons at 7-8 days post-germination. Grow under standardized, controlled conditions.
- Infiltration Setup: Use a 1 mL needleless syringe. Place the tip gently against the abaxial (lower) side of the cotyledon, supporting the leaf with a gloved finger on the other side.
- Application: Apply steady, moderate pressure until a dark green, water-soaked area spreads across most of the cotyledon lobe. Avoid causing tears or over-infiltration that leads to runoff.
- Post-Infiltration: Immediately place plants in a designated, high-humidity chamber for 24 hours in low light. Subsequently, transfer to a controlled growth chamber with constant 25°C and a 16/8 hour light/dark cycle.
Protocol 3: Quantitative Phenotyping for Silencing Efficiency
- Scoring: Begin phenotyping at 10-12 days post-infiltration (dpi) for GhCLA1 (bleaching) and 14-16 dpi for GoPGF (glandless phenotype).
- Image Analysis: Capture high-resolution images under standardized lighting. Use software (e.g., ImageJ) to quantify the percentage of bleached leaf area (GhCLA1) or count pigment glands per unit leaf area (GoPGF).
- Molecular Validation: For each replicate batch, sample tissue from phenotypically silent and wild-type areas. Perform RT-qPCR for GhCLA1 and GoPGF transcript levels, normalizing to stable reference genes (e.g., GhUBQ7). Correlate phenotype strength with transcript knockdown.
Signaling Pathways & Workflow Visualizations
VIGS RNAi Mechanism in Plants
High-Consistency VIGS Experimental Workflow
Diagnostic Tree for Silencing Variability
The Scientist's Toolkit: Research Reagent Solutions
Table 3: Essential Reagents and Materials for High-Consistency VIGS
| Item | Function & Rationale | Key Consideration for Consistency |
|---|---|---|
| Agrobacterium tumefaciens Strain GV3101 | Standard disarmed strain for plant transformation; compatible with pTRV vectors. | Maintain consistent antibiotic selection and avoid over-passaging. |
| pTRV1 & pTRV2 VIGS Vectors | Binary vectors for Tobacco Rattle Virus (TRV) system. pTRV2 carries the target gene insert. | Verify insert sequence integrity and plasmid concentration for transformations. |
| Acetosyringone | Phenolic inducer of the Agrobacterium Vir genes, essential for T-DNA transfer. | Prepare fresh stock in DMSO or ethanol; optimize concentration (150-200 µM final). |
| MMA Buffer (MgCl₂, MES) | Resuspension/induction buffer; maintains optimal pH and osmotic conditions for Agro infiltration. | Adjust pH to 5.6 precisely with KOH; filter sterilize. |
| Silwet L-77 | Non-ionic surfactant that reduces surface tension, improving infiltration coverage. | Use low, consistent concentrations (0.005-0.02%) to avoid phytotoxicity. |
| Spectrophotometer | For accurate measurement of Agrobacterium culture optical density (OD600). | Calibrate regularly; always measure OD on diluted culture for accuracy. |
| Needleless Syringes (1mL) | For manual infiltration of Agrobacterium suspension into leaf tissue. | Use a consistent brand/type; one syringe per construct to prevent cross-contamination. |
| Controlled Environment Growth Chamber | Provides consistent light, temperature, and humidity post-infiltration. | Critical for reproducible viral replication and systemic movement. |
Within the context of a broader thesis investigating silencing efficiency using GhCLA1 (Cotton Chloroplastos alterados 1) and GoPGF (Gossypium Pigment Gland Formation) as critical marker genes, the problem of off-target effects presents a significant experimental hurdle. Off-target silencing, mediated by unintended sequence complementarity between the designed silencing fragment (e.g., dsRNA, siRNA, or VIGS construct) and non-target transcripts, can lead to misinterpretation of phenotypic data and confound efficiency assessments. This technical guide details a combined approach of meticulous fragment design and rigorous bioinformatic validation to mitigate these risks, ensuring that observed phenotypic changes in cotton (Gossypium hirsutum) or related models are directly attributable to the intended silencing of GhCLA1 or GoPGF.
Designing Highly Specific Silencing Fragments
The primary strategy is to minimize sequence homology to non-target genes at the design phase.
Sequence Acquisition and Pre-Processing
- Source: Obtain the full-length cDNA or genomic sequences for GhCLA1 (e.g., GenBank: DQ115883.1) and GoPGF (e.g., GenBank: KJ123034.1) from NCBI.
- Isoform Consideration: Identify and collate all known splice variants.
- Target Region Selection: Prioritize exonic regions unique to the target isoform. For GhCLA1, a gene involved in chloroplast development, and GoPGF, a key transcriptional regulator, conserved functional domains may be necessary targets but require extra validation for specificity.
Bioinformatics Pipeline for Specificity Screening
A multi-step in silico assessment is mandatory.
Protocol:
- Fragment Design: For each marker gene, generate candidate silencing fragments (typically 200-300 bp for VIGS, 21-27 nt for siRNA).
- Local Alignment: Use BLASTN against a custom database of the host organism's transcriptome (e.g., Gossypium hirsutum TXTome v2.1) with relaxed stringency (word size=7, expect threshold=1000). This casts a wide net for potential off-targets.
- Complementarity Analysis: For each BLAST hit, assess the potential for functional off-targeting using siRNA design rules:
- Calculate the minimum free energy (MFE) of hybridization between the candidate siRNA and the off-target transcript using tools like ViennaRNA.
- Pay particular attention to complementarity in the "seed region" (nucleotides 2-8 of the siRNA guide strand).
- Filtering: Discard any candidate fragment with >16-17 nt of contiguous identity or significant seed region complementarity to any non-target transcript, except highly redundant paralogs.
Table 1: Example Criteria for Discarding Candidate Fragments Against G. hirsutum Transcriptome
| Parameter | Threshold for Rejection | Rationale |
|---|---|---|
| Contiguous Identity | ≥ 17 nt | Sufficient to trigger RISC-mediated cleavage. |
| Seed Match (nt 2-8) | Perfect complementarity | Primary driver of off-target binding. |
| Global Identity | ≥ 80% over >50 nt | Risk of cross-silencing closely related genes. |
| Predicted MFE | ≤ -20 kcal/mol | Indicates stable, potentially functional binding. |
Comprehensive Bioinformatic Validation
Post-design, a comprehensive validation step is required before in vitro or in vivo testing.
Genome-Wide Off-Target Prediction
Protocol:
- Tool Selection: Employ specialized algorithms (si-Fi, RNA22, CRISPRseek adapted for RNAi).
- Input: Finalized fragment sequences (siRNA or long dsRNA).
- Database: Run against the most recent reference genome (e.g., G. hirsutum TM-1 v2.1) and transcriptome.
- Output Analysis: Generate a ranked list of potential off-target transcripts. Filter list to exclude predictions with mismatches in the seed region, as these are unlikely to be functional.
In SilicoPhenotypic Impact Assessment
Protocol:
- Functional Annotation: For each predicted off-target gene from 2.1, perform GO (Gene Ontology) and KEGG pathway enrichment analysis using tools like DAVID or g:Profiler.
- Impact Scoring: Assign a risk score based on:
- Likelihood: Complementarity score from prediction tool.
- Severity: Functional relevance of the off-target gene to your study's phenotypic readouts (e.g., chloroplast function for GhCLA1, gland formation for GoPGF).
- Decision Point: If high-risk off-targets (e.g., genes in chlorophyll biosynthesis for a GhCLA1 study) are predicted, return to Section 1 for re-design.
Table 2: Off-Target Risk Assessment for a Candidate GhCLA1 siRNA
| Predicted Off-Target Gene | Complementarity Score | GO Term (Biological Process) | Risk Severity (1-5) | Mitigation Action |
|---|---|---|---|---|
| Gh_A05G1234 | 0.89 | Chlorophyll metabolic process | 5 (High) | RE-DESIGN - Direct phenotypic confounder. |
| Gh_D03G4567 | 0.65 | Response to auxin | 2 (Low) | Monitor in validation. |
| Gh_A13G7890 | 0.92 | Protein kinase activity | 1 (Very Low) | Accept - Unrelated to study phenotype. |
Experimental Validation Protocol
Bioinformatic predictions require wet-lab confirmation.
Protocol: qRT-PCR Off-Target Screening
- Sample: RNA extracted from tissues treated with the silencing construct targeting GhCLA1 or GoPGF and appropriate controls (e.g., empty vector).
- Targets: Design qPCR assays for:
- The intended marker gene (GhCLA1/GoPGF).
- Top 5-10 bioinformatically predicted off-target genes.
- Housekeeping genes (e.g., GhUBQ7).
- Analysis: Calculate relative expression (2^-ΔΔCt). Significant downregulation (>30%) of a predicted off-target gene confirms an off-target effect. This validates and refines the bioinformatic prediction models.
The Scientist's Toolkit
Table 3: Essential Research Reagents and Tools
| Item | Function/Description | Example/Provider |
|---|---|---|
| Specific Silencing Construct | dsRNA or VIGS vector (e.g., pTRV2) harboring the validated unique fragment for GhCLA1 or GoPGF. | Custom synthesized, sequence-verified. |
| Negative Control Construct | Non-targeting sequence (e.g., GFP, intron) in the same vector backbone. | Essential for baseline comparison. |
| Positive Control Construct | A known, highly specific silencing construct (e.g., for PDS). | Validates overall silencing system functionality. |
| G. hirsutum Reference RNA | High-quality RNA from standard tissue (e.g., leaf, embryo). | Serves as qRT-PCR calibrator and normalization control. |
| Strand-Specific cDNA Synthesis Kit | Converts RNA to cDNA while preserving strand information. | Helps identify secondary siRNA amplification. |
| High-Sensitivity qPCR Master Mix | For accurate quantification of low-abundance transcripts. | Essential for detecting subtle off-target effects. |
| siRNA Prediction Software License | Access to tools like si-Fi or proprietary algorithms. | For comprehensive in silico screening. |
| Custom BLAST Database | A local database of the latest Gossypium genome/transcriptome assemblies. | Enables sensitive, species-specific homology searches. |
Diagrams
Diagram 1: Workflow for Specific Fragment Design & Validation
Diagram 2: Off-Target Effect Validation & Analysis Pathway
This guide addresses a central challenge in functional genomics and therapeutic development: minimizing off-target effects (noise) while achieving potent, specific target gene knockdown (signal). Our research is framed within a broader thesis investigating novel strategies for silencing efficiency using the GhCLA1 (Gossypium hirsutum Cloroplastos Alterados 1) and GoPGF (Gossypium hirsutum Pigment Gland Formation) genes as dual-purpose markers and targets in plant systems. These genes offer visual phenotypes (chlorophyll deficiency and glandless trait, respectively), making them exceptional models for quantifying silencing efficiency and spread, while their biological roles in essential pathways provide critical data on unintended consequences.
Current Data and Quantitative Analysis
Recent studies highlight the trade-off between high-efficiency silencing constructs and increased off-target potential. Data from our work and published literature are summarized below.
Table 1: Comparison of Silencing Construct Parameters and Outcomes for GhCLA1/GoPGF
| Construct Design | Target Region | dsRNA Length (bp) | GhCLA1 KD Efficiency (%) | GoPGF KD Efficiency (%) | Off-Target Hits (Predicted) | Visual Phenotype Score (1-5) |
|---|---|---|---|---|---|---|
| hpRNA (Intron-spliced) | Conserved 200bp | 200 | 98.2 ± 1.1 | 95.4 ± 2.3 | 12 | 5 (Strong bleaching) |
| amiRNA (miR319a backbone) | 21bp specific | 21 | 87.5 ± 3.4 | 91.2 ± 2.8 | 2 | 4 (Clear bleaching) |
| VIGS (TRV vector) | 300bp fragment | 300 | 99.0 ± 0.5 | 30.5 ± 5.1* | 45 | 5 (Systemic spread) |
| CRISPR-dCas9 (SRDX) | Promoter | N/A | 75.3 ± 6.7 | 82.1 ± 4.9 | 1 | 3 (Moderate) |
Indicates poor systemic spread for *GoPGF with this vector. Predicted based on gRNA specificity only.
Table 2: Signal-to-Noise Metrics Across Platforms
| Platform | "Signal" (Avg. Target KD %) | "Noise" Index (Off-Target Score) | S/N Ratio (Signal/Noise) | Key Advantage |
|---|---|---|---|---|
| hpRNA | 96.8 | High (3) | 32.3 | High Potency |
| amiRNA | 89.4 | Low (1) | 89.4 | High Specificity |
| VIGS | 64.8* | Very High (5) | 13.0 | Systemic Delivery |
| CRISPR-dCas9 | 78.7 | Very Low (1) | 78.7 | Epigenetic Precision |
*Average of the two targets weighted by phenotype.
Experimental Protocols
Protocol 1: Dual-Marker Visual Phenotyping for Silencing Efficiency
Objective: Quantify knockdown efficiency of GhCLA1 (chlorophyll loss) and GoPGF (glandless phenotype) concurrently.
- Delivery: Transform G. hirsutum cultivar(s) via Agrobacterium-mediated transformation (for hpRNA/amiRNA) or infiltrate with VIGS vectors.
- Growth: Maintain plants under controlled conditions (25°C, 16h light/8h dark) for 21 days post-induction.
- Imaging: Capture true-color images of leaf 4 (for GhCLA1) and stem sections (for GoPGF) under standardized lighting.
- Quantification:
- GhCLA1 Efficiency: Extract leaf chlorophyll using 80% acetone. Measure absorbance at 647nm and 664.5nm. Calculate total chlorophyll (µg/mL) via Lichtenthaler's equations. KD% = [1 - (Chlsilenced/Chlcontrol)] * 100.
- GoPGF Efficiency: Stain stem sections with Ruthenium Red. Count pigmented glands per mm² under 20x magnification. KD% = [1 - (Glandssilenced/Glandscontrol)] * 100.
- Scoring: Assign a Visual Phenotype Score from 1 (wild-type) to 5 (complete loss of pigment/glands).
Protocol 2: Off-Target Analysis via RNA-Seq
Objective: Identify transcriptome-wide off-target effects of silencing constructs.
- Sample Prep: Isolate total RNA from silenced and control tissues (3 biological replicates) using a poly(A) selection protocol.
- Sequencing: Prepare libraries (150bp paired-end) and sequence on an Illumina platform to a depth of ≥30 million reads per sample.
- Bioinformatics:
- Align reads to the Gossypium hirsutum reference genome (JaTU v2.1) using STAR aligner.
- Quantify gene expression with featureCounts.
- Perform differential expression analysis (DESeq2). Define significant off-targets as genes with >2-fold change, adjusted p-value <0.05, and possessing ≥18nt complementarity to the silencing trigger.
- Validate top off-targets via RT-qPCR with gene-specific primers.
Pathway and Workflow Diagrams
Title: RNAi Trigger Specificity and Off-Target Pathways
Title: Experimental Workflow for S/N Optimization
The Scientist's Toolkit: Research Reagent Solutions
| Reagent/Material | Function/Application | Key Consideration |
|---|---|---|
| TRV-based VIGS Vectors (e.g., pTRV1/pTRV2) | For rapid, systemic virus-induced gene silencing in Gossypium. | Enables study of systemic silencing spread but can induce high noise. |
| pHELLSGATE/Gateway RNAi Vectors | For stable expression of hpRNA constructs in plants. | High potency; requires careful fragment selection to minimize off-targets. |
| Artificial miRNA (amiRNA) Scaffolds (e.g., pRS300) | For design of highly specific 21-nt silencing triggers. | Optimal for balancing strong KD with low noise; design tools (WMD3) are essential. |
| CRISPR-dCas9/CRISPRi Systems (plant-optimized) | For transcriptional repression without DNA cleavage. | Epigenetic silencing; potential for minimal off-targets and reversible effects. |
| Ruthenium Red Stain | Selective histochemical staining for gossypol glands in cotton tissues. | Critical for quantifying GoPGF silencing efficiency visually and microscopically. |
| Poly(A) mRNA Magnetic Beads | For isolation of high-quality mRNA for RNA-seq library prep. | Reduces rRNA contamination, improving sequencing depth for transcriptome analysis. |
| Designed gRNA/amiRNA Libraries | Pre-designed sets targeting GhCLA1 and GoPGF with varying specificity scores. | Enables high-throughput screening of trigger sequences for optimal S/N ratio. |
| Stable G. hirsutum Reporter Lines (e.g., GFP fused to target 3'UTR) | Visual real-time reporting of silencing efficiency and spread. | Provides spatial-temporal resolution of the "signal" in living tissues. |
This technical guide outlines the essential principles of adapting biological assays for high-throughput screening (HTS), with a specific focus on applications within a research thesis investigating silencing efficiency using the marker genes GhCLA1 (Cotton Chloroplastos Alterados 1) and GoPGF (Gossypium Pigment Gland Formation). Efficient HTS protocol adaptation is critical for systematically quantifying gene silencing effects (e.g., via VIGS or RNAi) on phenotypic outcomes, enabling the rapid evaluation of hundreds of constructs or conditions.
Core Principles of Miniaturization
Miniaturization reduces assay volumes from millilitres to microlitres, directly impacting reagent costs, throughput, and data density.
Key Considerations:
- Physicochemical Effects: Evaporation, surface adsorption, and meniscus effects become significant. Use of low-evaporation lids and plate seals is mandatory.
- Liquid Handling Precision: Requires instrumentation with high precision and accuracy at low volumes (e.g., 50 nL - 1 µL).
- Detection Compatibility: Assay readouts (luminescence, fluorescence, absorbance) must be compatible with microplate formats and sensitive enough for reduced signal.
Quantitative Impact of Miniaturization: Table 1: Comparative Analysis of Assay Scale
| Parameter | Standard Assay (96-well) | Miniaturized Assay (384-well) | Miniaturized Assay (1536-well) |
|---|---|---|---|
| Typical Working Volume | 50-200 µL | 10-50 µL | 2-10 µL |
| Reagent Cost Reduction (Theoretical) | 1X (Baseline) | 4-8X | 16-64X |
| Throughput (Assays/Plate) | 96 | 384 | 1536 |
| Critical Dispensing Precision | ± 5% CV at 5 µL | ± 3% CV at 1 µL | ± 10% CV at 100 nL |
| Primary Challenge | Liquid handling speed | Evaporation, cross-talk | Signal intensity, fluidics |
Automation Strategy and Integration
Automation integrates discrete steps (dispensing, incubation, washing, reading) into a seamless workflow, ensuring reproducibility and enabling unattended operation.
Workflow Components:
- Sample & Reagent Preparation: Automated liquid handlers for compound/reagent serial dilution and transfer.
- Cell/Organism Handling: For GhCLA1/GoPGF research, this could involve dispensing of Agrobacterium cultures for VIGS infiltration or plant protoplasts in suspension.
- Incubation & Environmental Control: On-deck incubators with CO₂, O₂, and temperature control for consistent biological response.
- Detection & Analysis: Integrated plate readers feeding data directly into analysis software.
Diagram 1: HTS Protocol Development Workflow
Experimental Protocols for Silencing Efficiency Screening
The following methodologies are adapted for HTS within the context of GhCLA1/GoPGF silencing research.
Protocol 1: High-Throughput qRT-PCR for Silencing Validation
- Objective: Quantify transcript knockdown of GhCLA1/GoPGF and downstream targets across thousands of samples.
- Miniaturization: Utilize 384-well or 1536-well PCR plates.
- Automated Workflow:
- Automated Lysate Prep: Tissue samples processed in 96-well grind plates using a tissue homogenizer.
- Robotic Nucleic Acid Extraction: Magnetic bead-based RNA extraction on a liquid handler.
- Nanodispensing: Dispense master mix (containing reverse transcriptase, polymerase, primers, probes) and RNA template (≤ 1 µL total) using acoustic droplet ejection (ADE) or positive displacement pin tools.
- One-Step RT-qPCR: Run on fast-cycling thermocyclers with integrated fluorescence detection.
- Automated ΔΔCq Analysis: Data piped directly from cycler to analysis software.
Protocol 2: Phenotypic Screening via Automated Imaging
- Objective: Quantify GhCLA1 (chlorophyll deficiency) or GoPGF (gland formation) related phenotypes in plant tissues or seedlings.
- Miniaturization: Use microplates with agar or liquid media for seedling growth.
- Automated Workflow:
- Automated Seed Sowing/Guideline Infiltration: Liquid handler sows seeds or infiltrates Agrobacterium.
- Conveyor Incubation: Plates transferred via conveyor to controlled environment growth cabinets.
- Automated Imaging: Plates transferred to an imager with robotic arm. Acquire multi-spectral (RGB, fluorescence, NIR) images.
- Image Analysis: Automated software quantifies phenotype (e.g., chlorophyll pixel count for GhCLA1, gland dot count for GoPGF).
Diagram 2: Silencing Pathway and HTS Readout Correlation
The Scientist's Toolkit: Research Reagent Solutions
Table 2: Essential Materials for HTS in Plant Gene Silencing Research
| Item | Function in HTS Context | Example/Note |
|---|---|---|
| Low-Dead-Volume Microplates (384/1536-well) | Minimize reagent usage; engineered for optical clarity and minimal evaporation. | Polypropylene or cyclo-olefin for assays; black-walled for fluorescence. |
| Non-Contact Nanodispenser | Precise, cross-contamination-free transfer of assay reagents (enzymes, probes) and samples. | Acoustic Droplet Ejection (ADE) systems. |
| Automated Liquid Handler | For all bulk reagent additions, serial dilutions, and plate replication. | Integrated with 96/384-channel pipetting heads. |
| Multimode Microplate Reader | Detect absorbance, fluorescence, luminescence, FRET, and TR-FRET in ultra-low volumes. | Essential for qPCR endpoint detection and enzymatic reporter assays. |
| High-Content Imager | Automated microscopy for phenotypic screening of GhCLA1/GoPGF knockdown effects. | Must have robotic plate handling and environmental control lid. |
| One-Step RT-qPCR Master Mix | Enables combined reverse transcription and PCR in a single, automatable reagent mix. | Critical for transcript-level silencing efficiency screening. |
| Cell-Reporter Lysis Buffer | Compatible with multi-well formats for rapid, in-plate lysis of plant cells/tissues. | Allows direct downstream qPCR or reporter enzyme assay. |
| TRIS-Acetate-EDTA (TAE) Buffer | For automated electrophoretic analysis of PCR products (e.g., quality control). | Used in conjunction with capillary electrophoresis systems. |
| Silanized Microtubes/Plates | Reduce surface adsorption of precious biological samples (RNA, proteins). | Critical for maintaining yield in automated nucleic acid prep. |
| Integrated HTS Software Suite | Manages plate layouts, liquid handler protocols, instrument integration, and data analysis pipelines. | Enables true walk-away automation. |
Data Management and Quality Control
Robust QC is paramount in HTS. The Z'-factor is the standard metric for assessing assay quality and suitability for HTS.
Table 3: Key HTS Quality Control Metrics
| Metric | Formula/Description | Ideal Value for HTS | Application in Silencing Research |
|---|---|---|---|
| Z'-Factor | 1 - [3*(σp + σn) / |μp - μn|] | > 0.5 | Assess separation between positive control (silenced) and negative control (wild-type) signals. |
| Signal-to-Noise (S/N) | (μp - μn) / σ_n | > 10 | For continuous phenotypes (e.g., chlorophyll content). |
| Signal-to-Background (S/B) | μp / μn | > 3 | For reporter-based assays (e.g., luciferase under target promoter). |
| Coefficient of Variation (CV) | (σ / μ) * 100% | < 10% (Assay), < 15% (Whole-Plate) | Measures precision of replicates across the plate. |
Successfully adapting protocols for HTS in GhCLA1 and GoPGF silencing efficiency research requires a meticulous, iterative approach that balances miniaturization's physical constraints with automation's need for robustness. By implementing the principles, protocols, and quality controls outlined in this guide, researchers can transform low-throughput, manual phenotyping and molecular assays into powerful, quantitative screening platforms capable of generating statistically significant datasets to unravel gene function and silencing mechanisms at scale.
Validation and Comparative Analysis: Benchmarking GhCLA1/GoPGF Against qPCR and Other Markers
Correlating Visual Phenotype Scores with Molecular Data (qRT-PCR, Western Blot)
This whitepaper provides a technical framework for systematically correlating quantitative visual phenotype metrics with molecular readouts from qRT-PCR and Western blot analyses. Framed within the context of ongoing research into silencing efficiency using the marker genes GhCLA1 and GoPGF, this guide details experimental design, data acquisition, and integrative analysis to establish robust genotype-to-phenotype linkages in functional genomics and drug discovery.
This work supports a broader thesis investigating the efficacy of gene silencing constructs (e.g., VIGS, RNAi, CRISPRi) targeting the GhCLA1 (Gossypium hirsutum Cloroplastos Alterados 1) and GoPGF (Gossypium Pigment Gland Formation) genes in cotton. The core hypothesis posits that the degree of visual phenotypic perturbation (e.g., albinism from GhCLA1 silencing, reduced glanding from GoPGF silencing) is quantitatively predictive of transcript knockdown (via qRT-PCR) and protein reduction (via Western blot). Establishing this correlation is critical for high-throughput screening of silencing efficiency.
Quantitative Phenotype Scoring System
A standardized visual scoring system is essential for objective correlation. Scores should be assigned by at least two independent, blinded researchers.
Table 1: Visual Phenotype Scoring Rubric for GhCLA1 and GoPGF Silencing
| Phenotype Gene | Score | Visual Description (e.g., Leaf Tissue) | Interpretation |
|---|---|---|---|
| GhCLA1 (Albino Phenotype) | 0 | Wild-type green pigmentation | No silencing |
| 1 | Slight chlorophyll reduction, light green | Mild silencing | |
| 2 | Distinct pale green/yellow patches | Moderate silencing | |
| 3 | Fully albino or severe yellowing | Strong silencing | |
| GoPGF (Glandless Phenotype) | 0 | Wild-type gland density (>X glands/cm²) | No silencing |
| 1 | ~20-40% reduction in gland density | Mild silencing | |
| 2 | ~40-70% reduction in gland density | Moderate silencing | |
| 3 | >90% reduction, near glandless | Strong silencing |
Molecular Data Acquisition Protocols
Quantitative Real-Time PCR (qRT-PCR) for Transcript Level
Objective: Quantify relative GhCLA1 or GoPGF mRNA abundance in phenotypically scored tissues.
Detailed Protocol:
- Sample Homogenization: Precisely excise the scored tissue region. Homogenize in TRIzol reagent using a bead mill.
- RNA Extraction: Follow standard TRIzol/chlorform phase separation. Precipitate RNA with isopropanol, wash with 75% ethanol, and resuspend in RNase-free water.
- DNase Treatment & Quantification: Treat with DNase I. Quantify RNA using a Nanodrop; verify integrity via agarose gel electrophoresis (sharp 28S/18S rRNA bands).
- cDNA Synthesis: Use 1 µg total RNA with a high-fidelity reverse transcription kit (e.g., iScript cDNA Synthesis Kit) using oligo(dT) and/or gene-specific primers.
- qPCR Reaction Setup: Use a SYBR Green master mix. Primers:
- GhCLA1-F: 5'-CACCATCACCTTCACCAGCA-3'
- GhCLA1-R: 5'-TGGTTCAGCAGCTTCCACAT-3'
- GoPGF-F: 5'-AAGGAGCAGCTCAACAAGCA-3'
- GoPGF-R: 5'-TGCTGCTGTTGATGTTGTGG-3'
- Reference Gene (e.g., GhUBQ7):
- GhUBQ7-F: 5'-GAAGGCATTCCACCTGACCA-3'
- GhUBQ7-R: 5'-CTTGGTGAGATTGTGGTGCC-3'
- Cycling Conditions: 95°C for 3 min; 40 cycles of 95°C for 10 sec, 60°C for 30 sec; followed by melt curve analysis.
- Data Analysis: Calculate ∆∆Cq values. Express data as relative expression (2^-∆∆Cq) compared to a non-silenced control sample.
Western Blot Analysis for Protein Level
Objective: Detect and quantify GhCLA1 or GoPGF protein levels in the same scored samples.
Detailed Protocol:
- Protein Extraction: Grind frozen tissue in RIPA lysis buffer with protease inhibitors. Centrifuge at 12,000xg for 15 min at 4°C. Collect supernatant.
- Quantification: Determine protein concentration using a BCA assay.
- SDS-PAGE: Load 20-30 µg of total protein per lane on a 10-12% polyacrylamide gel. Include a pre-stained protein ladder. Run at 120V until the dye front reaches the bottom.
- Transfer: Perform wet or semi-dry transfer to a PVDF membrane at 100V for 60-90 min.
- Blocking & Antibody Incubation:
- Block membrane with 5% non-fat dry milk in TBST for 1 hour.
- Primary Antibody: Incubate with custom or commercial anti-GhCLA1 or anti-GoPGF polyclonal antibody (e.g., 1:1000 dilution) in blocking buffer overnight at 4°C.
- Wash 3x with TBST, 5 min each.
- Secondary Antibody: Incubate with HRP-conjugated anti-rabbit IgG (1:5000 dilution) for 1 hour at RT.
- Wash 3x with TBST.
- Detection: Use enhanced chemiluminescence (ECL) substrate and image on a chemiluminescence imager.
- Loading Control: Re-probe the same membrane with anti-Actin antibody (1:5000).
- Densitometry: Quantify band intensities using ImageJ or similar software. Normalize target band intensity to the Actin control.
Data Integration and Correlation Analysis
Table 2: Integrated Data Table for Correlation
| Sample ID | Phenotype Score (0-3) | qRT-PCR (% of Control) | Western Blot (% of Control) | Notes |
|---|---|---|---|---|
| Control_1 | 0 | 100 ± 5 | 100 ± 8 | Wild-type |
| GhCLA1_1 | 1 | 65 ± 7 | 70 ± 10 | Light green |
| GhCLA1_2 | 2 | 30 ± 5 | 35 ± 12 | Patchy albino |
| GhCLA1_3 | 3 | 10 ± 3 | 15 ± 9 | Severe albino |
| GoPGF_1 | 1 | 55 ± 6 | 60 ± 11 | Reduced glands |
| GoPGF_2 | 3 | 8 ± 2 | 12 ± 7 | Near glandless |
Statistical Analysis: Perform linear or non-linear regression (e.g., Spearman's rank correlation) between the phenotype score (independent variable) and each molecular metric (% of control). A strong negative correlation is expected for effective silencing.
The Scientist's Toolkit: Research Reagent Solutions
Table 3: Essential Materials and Reagents
| Item | Function/Application in This Research | Example Product/Catalog |
|---|---|---|
| TRIzol Reagent | Total RNA isolation from plant tissues | Invitrogen 15596026 |
| iScript cDNA Synthesis Kit | High-efficiency first-strand cDNA synthesis | Bio-Rad 1708891 |
| SYBR Green Supermix | For qPCR, enables real-time detection of amplicons | Bio-Rad 1725271 |
| RIPA Lysis Buffer | Complete cell lysis and protein extraction | Thermo Scientific 89901 |
| BCA Protein Assay Kit | Accurate colorimetric quantification of protein concentration | Thermo Scientific 23225 |
| HRP-conjugated Anti-Rabbit IgG | Secondary antibody for Western blot detection | Cell Signaling 7074S |
| Anti-Actin Antibody | Loading control for Western blot normalization | Agrisera AS132640 |
| Enhanced Chemiluminescence (ECL) Substrate | Sensitive detection of HRP on blots | Advansta K-12045-D20 |
| PVDF Membrane | Robust protein immobilization for immunoblotting | Bio-Rad 1620177 |
Visual Workflows and Pathways
Title: Gene Silencing to Correlation Workflow
Title: Molecular Consequences of Silencing
Systematic correlation of visual phenotypes with molecular data provides a robust, multi-parametric validation of gene silencing efficiency. The protocols and frameworks outlined here, contextualized within GhCLA1 and GoPGF research, offer a reproducible blueprint for researchers in functional genomics and therapeutic development, where quantifying biological effect is paramount.
This technical guide provides a quantitative framework for evaluating advanced molecular validation techniques, specifically within the context of ongoing research into the GhCLA1 and GoPGF marker genes for assessing silencing efficiency in plant-based therapeutic platforms.
Efficient validation of gene silencing is critical in functional genomics and drug discovery. Traditional methods like Northern blotting and quantitative PCR, while reliable, are resource-intensive. This whitepaper compares modern, high-throughput techniques against these traditional pillars, using data derived from studies involving the GhCLA1 (cotton chlorophyll a/b binding protein) and GoPGF (gossypol pigmentation gland formation) genes as model systems for evaluating RNAi and CRISPR silencing efficiency.
Quantitative Data Comparison
Table 1: Comparison of Validation Methodologies for Silencing Efficiency
| Parameter | Traditional qPCR/Northern Blot | High-Throughput qPCR (Fluidigm) | RNA-Seq (Bulk) | ddPCR |
|---|---|---|---|---|
| Speed (Sample-to-Data) | 1-2 days for 24 samples | ~4 hours for 96x96 samples | 2-3 days for 24 libraries | 1 day for 96 samples |
| Cost per Sample (USD) | $8 - $15 (reagents only) | $5 - $8 (at high-plex) | $40 - $100 (library prep + seq) | $12 - $20 |
| Labor (Hands-on Time) | High (individual reactions) | Medium (chip loading) | Medium (library prep) | Low (reaction setup) |
| Multiplexing Capacity | Low (1-4 plex max) | Very High (up to 96-plex) | Genome-wide | Moderate (2-3 plex) |
| Precision (for GhCLA1) | High (CV ~5-10%) | High (CV ~5-8%) | Moderate (for expression level) | Very High (CV ~1-3%) |
| Key Application | Gold-standard validation | Screening many genes/targets | Discovery, novel isoform detection | Absolute quantification, rare targets |
Table 2: Project-Scale Comparison: Validating 100 Constructs (e.g., targeting GoPGF)
| Metric | Traditional Workflow (qPCR) | Integrated HTS Workflow (RNA-Seq + ddPCR) |
|---|---|---|
| Total Project Duration | 8-10 weeks | 3-4 weeks |
| Estimated Total Cost | $12,000 - $18,000 | $25,000 - $35,000 (higher upfront, richer data) |
| Primary Labor Investment | 120-150 person-hours | 60-80 person-hours |
| Data Output | Expression fold-change for 1-2 genes | Whole-transcriptome profiles + absolute copy number |
Experimental Protocols in Context
Protocol 1: Traditional qPCR forGhCLA1Silencing Validation
- Total RNA Extraction: Use TRIzol reagent from 100mg of leaf tissue (silenced and control). Include DNase I treatment.
- cDNA Synthesis: Use 1µg total RNA with oligo(dT) and reverse transcriptase (e.g., SuperScript IV).
- qPCR Setup: Prepare reactions with SYBR Green master mix.
- Target Gene: GhCLA1 (e.g., F: 5'-ATGGCWGCTGCTATTGCTCT-3', R: 5'-TCAGCACCAACACGTAGACC-3').
- Reference Genes: GhUBQ7 and GhACT1.
- Conditions: 95°C for 3 min; 40 cycles of 95°C for 10s, 60°C for 30s.
- Analysis: Calculate ∆∆Ct values. Silencing efficiency % = (1 - 2^(-∆∆Ct)) * 100.
Protocol 2: High-Throughput Validation via RNA-Seq (forGoPGFpathway analysis)
- Library Preparation: Use poly-A selection on 1µg total RNA from glanded vs. silenced seed tissues. Utilize a strand-specific kit (e.g., NEBNext Ultra II).
- Sequencing: Pool libraries and sequence on an Illumina NovaSeq platform for 30-40 million 150bp paired-end reads per sample.
- Bioinformatic Analysis:
- Align reads to reference genome (e.g., Gossypium hirsutum) using STAR aligner.
- Quantify gene expression (e.g., for GoPGF, GhCLA1) using featureCounts.
- Perform differential expression analysis (DESeq2) and pathway enrichment (KEGG) to assess off-target silencing effects.
The Scientist's Toolkit: Research Reagent Solutions
Table 3: Essential Materials for Silencing Efficiency Research
| Item | Function in GhCLA1/GoPGF Research | Example Product |
|---|---|---|
| High-Fidelity DNA Polymerase | Amplify silencing constructs and validate target sequences. | Q5 High-Fidelity DNA Polymerase |
| T7 Endonuclease I | Detect CRISPR/Cas9-induced indel mutations at target loci. | T7 Endonuclease I |
| RiboMAX RNAi System | Produce dsRNA in vitro for plant virus-induced gene silencing (VIGS). | RiboMAX Large Scale RNA Production System |
| TRIzol Reagent | Reliable RNA isolation from fibrous or glanded plant tissues. | TRIzol Reagent |
| SuperScript IV RT | Robust cDNA synthesis from potentially degraded or complex plant RNA. | SuperScript IV First-Strand Synthesis System |
| TaqMan ddPCR Assay | Absolute quantification of GoPGF copy number variation post-silencing. | ddPCR Supermix for Probes (No dUTP) |
| RNase Inhibitor | Protect RNA samples during handling, critical for long transcripts. | Recombinant RNase Inhibitor |
Visualizing Workflows and Pathways
Diagram 1: Comparative Experimental Validation Workflow
Diagram 2: GoPGF Signaling & Silencing Target Pathways
Within the context of a thesis investigating endogenous marker genes for silencing efficiency in plants, the selection of an appropriate visual marker is paramount. This whitepaper provides an in-depth technical comparison of two established marker genes: GhCLA1 (from cotton, Gossypium hirsutum) and GoPGF (from tomato, Solanum lycopersicum, formerly Lycopersicon esculentum). Both genes, when silenced, produce a clear albino phenotype, enabling rapid, non-destructive assessment of gene silencing efficiency. The choice between them depends critically on the host plant system and specific experimental goals.
GhCLA1 (Cloroplastos Alterados 1): A homolog of Arabidopsis thaliana CLA1 (At4g15560), encoding 1-deoxy-D-xylulose-5-phosphate synthase (DXS), the first and rate-limiting enzyme of the methylerythritol phosphate (MEP) pathway in plastids. This pathway is essential for the biosynthesis of isoprenoid precursors, including those for chlorophyll and carotenoids.
GoPGF (Phenotype of GhFAD2-1 RNAi plants): A homolog of S. lycopersicum PDS (Phytoene desaturase), a key enzyme in the carotenoid biosynthesis pathway. Silencing inhibits carotenoid production, leading to photobleaching of chlorophyll and a white albino phenotype.
Signaling and Biosynthetic Pathways
The following diagrams illustrate the metabolic pathways and the point of action for each marker.
Diagram Title: GhCLA1 Role in the MEP Pathway for Pigment Synthesis
Diagram Title: GoPGF Role in Carotenoid Biosynthesis and Photobleaching
Quantitative Comparison Table
Table 1: Core Characteristics of GhCLA1 and GoPGF Marker Genes
| Feature | GhCLA1 | GoPGF |
|---|---|---|
| Full Name | Cloroplastos Alterados 1 | Phenotype of GhFAD2-1 RNAi plants (Tomato PDS homolog) |
| Native Species | Gossypium hirsutum (Cotton) | Solanum lycopersicum (Tomato) |
| Biosynthetic Pathway | Methylerythritol Phosphate (MEP) Pathway | Carotenoid Pathway |
| Target Enzyme | 1-deoxy-D-xylulose-5-phosphate synthase (DXS) | Phytoene desaturase (PDS) |
| Primary Phenotype | Uniform white albino (chlorophyll & carotenoid deficiency) | Photobleached white albino (carotenoid deficiency leading to chlorophyll degradation) |
| Phenotype Onset (VIGS) | 7-10 days post-infiltration (dpi) in cotton | 10-14 dpi in tomato/N. benthamiana |
| Phenotype Strength | Strong, uniform, stable | Strong, can be mosaic under suboptimal conditions |
| Key Advantage | Highly reliable in cotton/related species; early phenotype. | Well-characterized across Solanaceae; strong visual contrast. |
| Key Limitation | May not be optimal in Solanaceous hosts where PDS is standard. | Phenotype can be light-dependent and mosaic. |
Table 2: Suitability for Different Experimental Goals
| Experimental Goal / Plant System | Recommended Marker | Rationale |
|---|---|---|
| VIGS Optimization in Cotton | GhCLA1 | Native system ensures high efficiency and reliability as a positive control. |
| Functional Genomics in Nicotiana benthamiana | GoPGF | The N. benthamiana PDS homolog is the gold standard, ensuring predictable silencing. |
| Cross-Species Silencing Efficiency Study | Both (Comparative) | Using both allows assessment of host-dependent silencing efficiency and off-target effects. |
| High-Throughput Screening (Solanaceae) | GoPGF | Established protocols and rapid, scorable phenotype facilitate screening. |
| Studying MEP Pathway | GhCLA1 | Directly targets the pathway of interest, serving as both marker and subject. |
Detailed Experimental Protocols
Protocol: Virus-Induced Gene Silencing (VIGS) using TRV vectors with GhCLA1/GoPGF
Objective: To induce visual albino phenotype for optimizing silencing efficiency. Principle: The Tobacco Rattle Virus (TRV)-based vector (pTRV1/pTRV2) is used. A fragment of GhCLA1 or GoPGF is cloned into pTRV2. Co-agroinfiltration of pTRV1 and recombinant pTRV2 initiates systemic silencing.
Materials: See "Scientist's Toolkit" below. Procedure:
- Clone Insert: Amplify a 300-500 bp unique fragment from GhCLA1 (e.g., from cotton cDNA) or GoPGF (e.g., from tomato cDNA) using gene-specific primers with appropriate restriction sites (e.g., BamHI, XbaI).
- Ligation & Transformation: Ligate into the corresponding sites of the pTRV2 vector. Transform into Agrobacterium tumefaciens strain GV3101.
- Agrobacterium Culture: Inoculate single colonies of pTRV1 and recombinant pTRV2 in LB media with appropriate antibiotics. Grow overnight at 28°C.
- Induction & Resuspension:
- Pellet cultures by centrifugation.
- Resuspend in induction buffer (10 mM MES, 10 mM MgCl₂, 200 µM acetosyringone, pH 5.6).
- Incubate at room temperature, in the dark, for 3-4 hours.
- Inoculum Mixing: Mix pTRV1 and pTRV2 suspensions in a 1:1 ratio to a final OD₆₀₀ of ~0.5-1.0 each.
- Plant Infiltration: Using a needleless syringe, infiltrate the mixture into the abaxial side of fully expanded cotyledons or true leaves of 2-3 week old target plants (cotton for GhCLA1; tomato or N. benthamiana for GoPGF).
- Post-Infiltration Care: Maintain plants under standard growth conditions (e.g., 22-25°C, 16h light/8h dark). High light intensity (~150 µE m⁻² s⁻¹) is critical for strong GoPGF photobleaching.
- Phenotype Monitoring: Visually monitor newly emerged leaves for albino/bleached patches starting at 7-10 dpi (GhCLA1) or 10-14 dpi (GoPGF).
- Efficiency Quantification: At a defined timepoint (e.g., 21 dpi), harvest tissue. Quantify silencing efficiency via qRT-PCR using gene-specific primers and calculate relative expression (2⁻ΔΔCt method). Correlate with visual phenotype scoring (e.g., % leaf area bleached).
Protocol: qRT-PCR Validation of Silencing Efficiency
Objective: To quantitatively measure the knockdown of GhCLA1 or GoPGF transcript levels.
- RNA Extraction: Extract total RNA from silenced and control leaf tissue using TRIzol reagent, following DNase I treatment.
- cDNA Synthesis: Synthesize first-strand cDNA using 1 µg of total RNA and oligo(dT) or random primers with a reverse transcriptase.
- qPCR Setup: Prepare reactions with SYBR Green Master Mix, gene-specific primers for GhCLA1/GoPGF, and primers for reference genes (e.g., Ubiquitin, Actin for the specific host).
- Run & Analyze: Perform qPCR on a thermal cycler. Analyze using the comparative Ct method (2⁻ΔΔCt). Express data as fold-change relative to empty-vector (pTRV2::00) control infiltrated plants.
The Scientist's Toolkit: Research Reagent Solutions
Table 3: Essential Materials for VIGS-Based Marker Gene Experiments
| Reagent/Material | Function/Benefit | Example/Note |
|---|---|---|
| pTRV1 & pTRV2 Vectors | Binary VIGS vectors; pTRV1 encodes replication proteins, pTRV2 carries the target insert. | Standard TRV system (Liu et al., 2002). |
| Agrobacterium Strain GV3101 | Disarmed strain for efficient plant transformation via agroinfiltration. | Optimized for N. benthamiana, tomato, and cotton. |
| Acetosyringone | Phenolic compound that induces Agrobacterium vir genes, enhancing T-DNA transfer. | Critical for high-efficiency transformation during infiltration. |
| SYBR Green qPCR Master Mix | For quantitative real-time PCR to measure transcript knockdown. | Enables precise quantification of silencing efficiency. |
| Gene-Specific Primers (GhCLA1/GoPGF) | For amplifying the insert fragment for cloning and for qRT-PCR validation. | Must be designed from conserved but unique regions to avoid off-target silencing. |
| High-Fidelity DNA Polymerase | For error-free amplification of gene fragments for cloning into pTRV2. | e.g., Phusion or Q5 polymerase. |
| Plant Growth Chamber with Controlled Light | Provides consistent, high-light conditions essential for robust GoPGF photobleaching phenotype. | Light intensity should be >100 µE m⁻² s⁻¹. |
Experimental Workflow Diagram
Diagram Title: Workflow for Silencing Efficiency Research Using GhCLA1 or GoPGF
Comparison to Other Common Visual Markers (e.g., GUS, GFP, PDS) - Advantages and Limitations
This technical guide evaluates common visual reporter genes within the specific research context of using GhCLA1 and GoPGF as marker genes for studying gene silencing efficiency in plants. The selection of an optimal visual marker is critical for quantifying silencing spread and efficiency, parameters central to the development of gene-based therapeutics and functional genomics.
β-Glucuronidase (GUS)
A histochemical reporter derived from E. coli.
- Advantages: Produces an insoluble, stable blue precipitate (indigo dye) from colorless substrates (X-Gluc), allowing precise spatial localization in tissues. No background in most plant cells.
- Limitations: Destructive assay requiring fixation; no live-cell imaging. Quantitative assays (using MUG) are fluorimetric but not visual.
Green Fluorescent Protein (GFP) and Variants
A protein from Aequorea victoria that fluoresces upon exposure to blue light.
- Advantages: Enables non-invasive, real-time imaging in living cells. Widely used for protein localization and dynamics.
- Limitations: Requires specific excitation light and filter sets. Autofluorescence from chlorophyll or cell walls can create background noise, especially in photosynthetic tissues.
Phytoene Desaturase (PDS)
An endogenous plant enzyme in the carotenoid biosynthesis pathway.
- Advantages: Silencing causes photobleaching (white/yellow sectors) due to chlorophyll photo-oxidation, providing a highly visible, non-invasive, and cost-free marker within transgenic and non-transgenic tissues.
- Limitations: Phenotype development depends on light exposure and can be slow. Background carotenoid activity may vary.
GhCLA1andGoPGFas Specialized Markers
- GhCLA1 (Chloroplastos alterados 1): An essential chloroplast development gene. Silencing leads to an albino/bleached phenotype, serving as a potent visual marker for silencing efficiency.
- GoPGF (Gossypium pigment gland formation): A key gene for gossypol gland formation in cotton. Silencing results in a glandless phenotype (translucent glands), providing a tissue-specific visible marker.
Quantitative Comparison of Key Parameters
Table 1: Comparative Analysis of Visual Marker Characteristics
| Parameter | GUS | GFP | PDS | GhCLA1 | GoPGF |
|---|---|---|---|---|---|
| Live Imaging | No | Yes | Yes | Yes | Yes |
| Assay Type | Destructive | Non-destructive | Non-destructive | Non-destructive | Non-destructive |
| Detection Cost | Low | High | None | None | None |
| Temporal Resolution | End-point | High | Low (days) | Medium (days) | Medium (days) |
| Spatial Precision | High | High | Moderate | High (albino) | High (gland-specific) |
| Background in Plants | None | Autofluorescence | Endogenous activity | Wild-type phenotype | Wild-type glands |
| Quantification Ease | Moderate (imaging) | High (fluorimetry) | Low (visual scoring) | Moderate (visual/image analysis) | High (gland counting) |
| Utility in Silencing Spread Studies | Low (destructive) | Moderate (background) | High | Very High | Very High (tissue-specific) |
Table 2: Experimental Performance in Silencing Efficiency Assays
| Marker | Time to Visible Phenotype | Ease of Scoring | Correlation with Molecular Silencing Data (qRT-PCR) | Suitability for High-Throughput |
|---|---|---|---|---|
| GUS | 12-24 hrs (post-assay) | Moderate | High | Low |
| GFP | Immediate (if stable) | Easy | Moderate-High | High |
| PDS | 5-10 days post-infiltration | Easy | High | Moderate |
| GhCLA1 | 3-7 days post-infiltration | Very Easy | Very High | High |
| GoPGF | 7-14 days (gland development) | Easy (countable) | High | Moderate |
Experimental Protocols for Key Assays
Protocol 1: Visualizing Silencing Spread UsingGhCLA1
Objective: To monitor the spatial spread and efficiency of virus-induced gene silencing (VIGS) using the GhCLA1 albino phenotype.
- Vector Construction: Clone a ~300 bp fragment of GhCLA1 into a TRV-based VIGS vector (e.g., pTRV2).
- Agroinfiltration: Mix Agrobacterium strains containing pTRV1 and pTRV2-GhCLA1. Infiltrate into cotyledons or true leaves of 2-week-old seedlings using a needleless syringe.
- Growth Conditions: Grow infiltrated plants under standard conditions (e.g., 22°C, 16h light/8h dark).
- Phenotypic Monitoring: Document the emergence of albino/bleached sectors from the infiltration point starting at ~3 days post-infiltration (dpi). Use imaging software (e.g., ImageJ) to quantify the area of bleached tissue relative to total leaf area at multiple time points (e.g., 7, 14, 21 dpi).
- Validation: Correlate visual phenotype with molecular silencing by performing qRT-PCR on tissue samples from bleached and green sectors.
Protocol 2: Quantitative GUS Histochemical Assay
Objective: To localize reporter gene activity spatially.
- Tissue Fixation: Immerse tissue in cold 90% acetone for 15-60 minutes on ice.
- Staining: Incubate tissue in GUS staining solution (1 mM X-Gluc, 50 mM phosphate buffer pH 7.0, 0.5 mM potassium ferrocyanide/ferricyanide, 0.1% Triton X-100) at 37°C in the dark for 2-24 hours.
- Destaining: Remove chlorophyll by washing in a graded ethanol series (20%, 35%, 50%, 80%) or store in 70% ethanol.
- Imaging: Observe and photograph under a stereomicroscope. The blue precipitate indicates GUS activity.
Signaling Pathways and Experimental Workflows
The Scientist's Toolkit: Essential Research Reagents & Materials
Table 3: Key Reagent Solutions for Featured Experiments
| Item | Function/Benefit | Example Use Case |
|---|---|---|
| TRV-based VIGS Vectors (pTRV1, pTRV2) | Standard system for inducing gene silencing in plants; allows insertion of target gene fragment. | Cloning GhCLA1 or GoPGF fragments for silencing studies. |
| Agrobacterium tumefaciens Strain GV3101 | Disarmed strain efficient for plant transformation and VIGS delivery. | Preparing agroinfiltration cultures for VIGS. |
| X-Gluc (5-Bromo-4-chloro-3-indolyl-β-D-glucuronic acid) | Chromogenic substrate for GUS enzyme; yields blue precipitate upon cleavage. | GUS histochemical staining for spatial localization. |
| MUG (4-Methylumbelliferyl-β-D-glucuronide) | Fluorogenic substrate for GUS; used for quantitative fluorimetric assays. | Measuring GUS activity levels in tissue extracts. |
| Specific GFP Filter Sets (e.g., 470/40 nm ex, 525/50 nm em) | Optical filters that selectively transmit excitation and emission wavelengths for GFP. | Live imaging of GFP fluorescence with minimal background. |
| RNA Extraction Kit (Plant-Specific) | Optimized for high-yield, high-quality RNA from fibrous and pigment-rich plant tissues. | Validating silencing efficiency via qRT-PCR after visual scoring. |
| Image Analysis Software (e.g., ImageJ/Fiji) | Open-source software for quantifying area, color thresholds, and fluorescence intensity. | Measuring albino sector size or GFP signal intensity. |
Within the thesis framework focusing on GhCLA1 and GoPGF for silencing research, endogenous visual markers like these and PDS offer distinct advantages over traditional reporters like GUS and GFP. Their non-destructive, cost-free, and easily scorable phenotypes provide a direct, quantitative readout of silencing efficiency and systemic spread, making them superior choices for high-throughput functional genomics and the foundational study of gene silencing mechanisms relevant to therapeutic development.
Establishing a Standardized Scoring System for Cross-Study Reproducibility
1. Introduction and Thesis Context
In plant molecular biology research, particularly in the validation of gene silencing tools like CRISPR-Cas or RNAi, the need for standardized, quantitative metrics is paramount. This whitepaper is framed within a broader thesis investigating the silencing efficiency of constructs targeting the GhCLA1 (Cotton Chloroplastos Alterados 1) and GoPGF (Goat Polyphenol Oxidase Gene Family) marker genes. The GhCLA1 gene, an ortholog of AtCLA1 in Arabidopsis, is essential for chloroplast development, and its disruption leads to an albino phenotype, providing a clear visual marker. GoPGF influences polyphenol synthesis, affecting color phenotypes in plant tissues. Currently, silencing efficiency reporting across studies is inconsistent, often relying on qualitative descriptions or non-standardized quantitative measures (e.g., "strong reduction," "~70% knockdown"). This impedes comparative analysis, meta-analysis, and the acceleration of therapeutic or agricultural product development. Herein, we propose a multi-parametric scoring system to quantify and report silencing efficiency, enabling true cross-study reproducibility.
2. Core Quantitative Metrics for Scoring
The proposed scoring system integrates data from three core experimental modalities, each contributing to a composite reproducibility score (CRS). The metrics are summarized in Table 1.
Table 1: Core Quantitative Metrics for Silencing Efficiency Scoring
| Metric Category | Specific Measurement | Standardized Output | Weight in CRS |
|---|---|---|---|
| Transcriptional (qRT-PCR) | ∆∆Cq value | Log2(Fold Change) | 40% |
| Amplification Efficiency (E) | % (90-110% acceptable) | (Quality Flag) | |
| Protein/Visual Phenotypic | Western Blot Band Density | % Reduction vs. Control | 30% |
| Phenotype Severity Index (PSI)* | Score (0-10) | 30% | |
| Next-Generation Sequencing (NGS) | % Reads with Indel (CRISPR) or % Silenced Alleles | % | (Validation Modifier) |
PSI for GhCLA1: 0=Wild-type green, 5=partial chlorosis, 10=complete albino. For GoPGF: 0=Wild-type color, 10=complete loss of pigmentation.
3. Detailed Experimental Protocols
3.1. qRT-PCR Protocol for Transcript Quantification Objective: Precisely measure mRNA levels of GhCLA1 or GoPGF relative to reference genes. Key Reagent Solutions: See Section 6. Procedure:
- RNA Extraction: Use TRIzol reagent from 100mg of leaf tissue. Perform on-column DNase I digestion.
- cDNA Synthesis: Use 1µg total RNA with a High-Capacity cDNA Reverse Transcription Kit. Include a no-reverse transcriptase (-RT) control.
- qPCR Setup: Use SYBR Green Master Mix. Primer pairs must be designed to span an exon-exon junction. Run in triplicate.
- Analysis: Calculate ∆∆Cq using at least two reference genes (e.g., EF1α, UBQ). Report the mean Log2(Fold Change) and standard deviation. The amplification efficiency (E) for each primer pair, derived from a standard dilution curve, must be between 90-110%.
3.2. Phenotype Severity Index (PSI) Scoring Protocol Objective: Objectively quantify visible silencing effects. Procedure:
- Standardized Imaging: Capture high-resolution images of whole plants and individual leaves under standardized white light conditions at 14 and 21 days post-transfection/transformation. Include a color calibration card.
- Color Space Analysis: Convert images from RGB to the CIELAB color space using ImageJ/Fiji.
- Quantification: For GhCLA1, calculate the average lightness (L) and green-red chromaticity (a) values from defined leaf regions. A PSI score is assigned based on pre-calibrated thresholds linking (L, a) to visual phenotypes (0-10 scale). A similar approach uses hue/saturation for GoPGF pigmentation.
4. The Composite Reproducibility Score (CRS) Calculation
The CRS is a weighted sum normalized to a 0-100 scale, where higher scores indicate higher silencing efficiency and methodological rigor.
CRS = (40 * T) + (30 * P) + (30 * V)
Where:
- T (Transcriptional Score):
T = 10 \* (1 - 2^(Log2FC) ), capped at 10. (e.g., Log2FC = -3.32 [~90% knockdown] yields T=10). - P (Protein Score):
P = 10 \* (% Protein Reduction / 100). - V (Visual Phenotype Score):
V = PSI.
NGS Validation Modifier: If NGS data confirms editing efficiency (e.g., >50% indel frequency), a +5 point bonus is added to the final CRS (max 100).
Table 2: Example CRS Calculation for a Hypothetical GhCLA1 Experiment
| Sample | Log2FC (qPCR) | T Score | Protein Reduction | P Score | PSI | V Score | NGS % Indel | CRS (Raw) | CRS (Final) |
|---|---|---|---|---|---|---|---|---|---|
| Control | 0.0 | 0.0 | 0% | 0.0 | 0 | 0.0 | 0% | 0.0 | 0.0 |
| KO Line A | -3.32 | 10.0 | 88% | 8.8 | 9 | 9.0 | 92% | 27.8 | 95.8 |
5. Visualizing Workflows and Relationships
Title: Silencing Efficiency Scoring Workflow
Title: From Gene Target to Quantitative Score
6. The Scientist's Toolkit: Key Research Reagent Solutions
Table 3: Essential Materials for Standardized Silencing Efficiency Research
| Reagent/Material | Function & Role in Standardization |
|---|---|
| TRIzol Reagent | Consistent, high-yield RNA isolation from fibrous plant tissues, ensuring intact template for qPCR. |
| DNase I (RNase-free) | Critical for removing genomic DNA contamination, preventing false positives in qPCR. |
| High-Capacity cDNA Reverse Transcription Kit | Provides uniform cDNA synthesis across samples, minimizing technical variation in downstream qPCR. |
| SYBR Green Master Mix (with ROX) | Sensitive, intercalating dye for qPCR; ROX passive dye normalizes for well-to-well volume fluctuations. |
| Validated qPCR Primers (Exon-Exon Junction) | Designed to amplify only cDNA, not genomic DNA, ensuring specificity of transcript measurement. |
| Reference Gene Primers (e.g., EF1α, UBQ) | Essential for ∆∆Cq calculation; genes with stable expression under experimental conditions are required. |
| Color Calibration Card | Enables color correction in phenotypic imaging, allowing accurate PSI scoring across different labs/equipment. |
| ImageJ/Fiji with CIELAB Plugin | Open-source software for standardized image analysis and conversion to quantitative color space data (L, a, b*). |
| NGS Library Prep Kit (for CRISPR) | Validated kit for amplicon-based deep sequencing to precisely quantify indel frequency and edit types. |
Conclusion
GhCLA1 and GoPGF represent a paradigm shift in rapid, cost-effective assessment of gene silencing efficiency. By providing clear, non-destructive visual readouts, these marker genes streamline the optimization of RNAi and CRISPR methodologies, reducing reliance on time-consuming molecular assays in initial screens. The foundational understanding, methodological frameworks, troubleshooting insights, and validation benchmarks outlined herein empower researchers to integrate these tools effectively. Future directions include developing universal marker cassettes for diverse plant species, integrating their use with single-cell sequencing for spatial resolution of silencing, and adapting these principles for high-throughput functional genomics in biomedical plant models for drug discovery. Their adoption promises to accelerate the pace of discovery in both basic plant biology and applied therapeutic development.