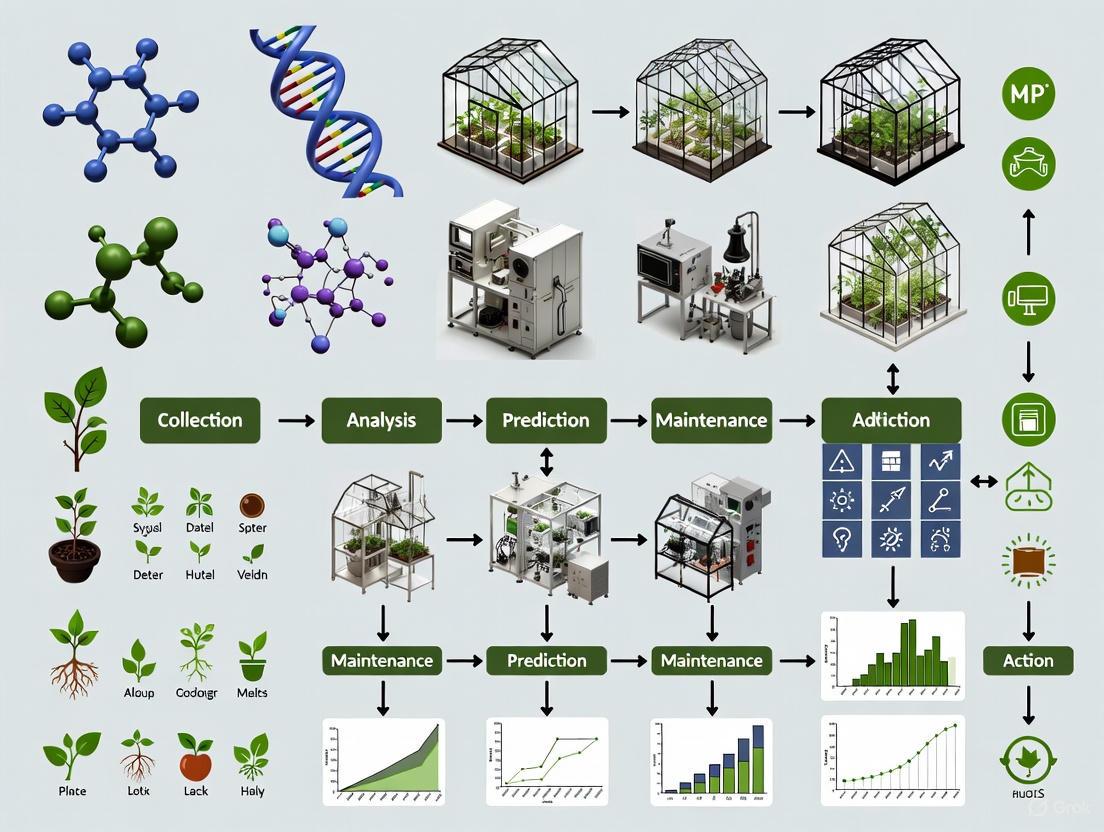
Predictive Maintenance for Plant Growth Equipment: A Data-Driven Framework for Biomedical Research
This article provides a comprehensive framework for implementing predictive maintenance (PdM) in plant growth equipment essential for biomedical and drug development research.
Predictive Maintenance for Plant Growth Equipment: A Data-Driven Framework for Biomedical Research
Abstract
This article provides a comprehensive framework for implementing predictive maintenance (PdM) in plant growth equipment essential for biomedical and drug development research. It explores the foundational shift from reactive to data-driven maintenance strategies, details the methodological application of IoT sensors and AI analytics, and offers practical guidance for troubleshooting and optimization. By validating the approach through comparative analysis of ROI and real-world case studies from precision industries, the content equips researchers and scientists with the knowledge to enhance equipment reliability, ensure experimental integrity, and optimize resource utilization in critical research environments.
From Reactive to Proactive: Understanding Predictive Maintenance in Research Environments
Defining Predictive Maintenance and Its Core Principles
For researchers, scientists, and drug development professionals, the integrity of plant growth equipment is not merely an operational concern but a foundational element of experimental validity. Unplanned equipment failures in plant growth chambers or specialized laboratory machinery can compromise months of meticulous research, leading to significant financial losses and delays in critical discoveries. This technical support center explores predictive maintenance—a proactive, data-driven strategy that moves beyond traditional preventive and reactive approaches. By implementing these principles, research facilities can enhance equipment reliability, protect valuable experiments from interruption, and optimize long-term operational costs [1] [2].
FAQs: Core Principles of Predictive Maintenance
Q1: What is predictive maintenance and how does it differ from preventive maintenance?
Predictive Maintenance (PdM) is a proactive strategy that uses real-time data from sensors, Internet of Things (IoT) devices, and advanced analytics to monitor the condition of equipment and predict exactly when a failure is likely to occur [2]. This allows maintenance to be performed just in time, based on the actual health of the asset.
The table below contrasts predictive maintenance with reactive and preventive approaches:
| Approach | Definition | Key Advantage | Key Disadvantage |
|---|---|---|---|
| Reactive Maintenance | Maintenance is performed only after a failure has occurred [2]. | Low initial cost, no planning needed [2]. | Unpredictable failures, costly downtime, and safety risks [2]. |
| Preventive Maintenance | Maintenance is performed on a fixed, time-based schedule (e.g., every 3 months) regardless of equipment condition [2]. | Reduces the chance of failure compared to a reactive approach; easy to plan and budget for [2]. | Can lead to over-maintenance, wasting time, money, and parts on equipment that is still healthy [2]. |
| Predictive Maintenance | Maintenance is performed only when needed, based on real-time data and analytics that detect early signs of wear [2]. | The most efficient use of resources; minimizes downtime and reduces long-term costs [2]. | Requires an initial investment in sensors, software, and data management capabilities [2]. |
Q2: What are the primary benefits of implementing predictive maintenance in a research setting?
Implementing predictive maintenance in a laboratory or growth facility delivers several critical benefits:
- Prevents Research Disruptions: The most significant benefit is the reduction of unplanned downtime [2]. For plant growth chambers, a failure in climate control can ruin long-term experiments. Predictive maintenance provides early warnings, allowing for repairs to be scheduled during planned intervals, thus protecting research integrity [1].
- Lowers Operational Costs: By preventing catastrophic failures and enabling timely, minor repairs, PdM helps avoid costly emergency repairs and spare part replacements. It also enhances energy efficiency; for example, a well-maintained growth chamber with modern LED lighting consumes less power [1] [2].
- Extends Equipment Lifespan: Proactive interventions based on actual equipment condition minimize wear and tear, thereby prolonging the useful life of valuable research assets [2].
- Enhances Employee Satisfaction: Reliable equipment fosters a more positive and productive research environment. Scientists can proceed with confidence, knowing their experiments are secure, which reduces stress and improves morale [1].
Q3: What are the most common challenges in implementation and how can they be overcome?
While powerful, implementing a predictive maintenance program comes with challenges. The following table outlines common barriers and proven solutions:
| Challenge | Occurrence Rate | Impact | Recommended Solution |
|---|---|---|---|
| Workforce Resistance & Skills Gap | 55-80% [3] | Delayed value realization, poor system adoption, and inaccurate data interpretation [3]. | Secure stakeholder buy-in early, invest in comprehensive training (60-80 hours per person), and develop a strong change management plan [4] [3]. |
| Data Quality Issues | 60-75% [3] | False predictions and alerts, which undermine the system's credibility and lead to mistrust [3]. | Start with a pilot project on critical assets to ensure data quality, and implement sensors that continuously measure key parameters like vibration and temperature [4]. |
| Integration with Legacy Systems | 70-85% [3] | Siloed operations, manual data workarounds, and incomplete asset visibility [3]. | Choose predictive maintenance platforms with open APIs and cloud-based architecture to reduce integration complexity. Consider phased deployment [3]. |
| Initial Investment & ROI Justification | 50-65% [3] | Budget constraints and project delays or cancellations [3]. | Begin with a small-scale proof-of-concept project on a high-value asset. Such projects can start for as little as \$10,000 and demonstrate a rapid ROI, often within months, to justify further investment [4]. |
Quantitative data indicates that facilities that systematically address these challenges can achieve success rates of 85-90% and realize maintenance cost reductions of 40-55% [3].
Troubleshooting Guides
Guide 1: Resolving False Alerts and Inaccurate Predictions
Symptoms: The predictive maintenance system generates frequent alerts that do not correlate with actual equipment problems, or it fails to predict a failure that subsequently occurs.
Diagnosis and Resolution:
- Verify Sensor Data Integrity: False alerts are often a data quality issue. Check the sensors generating the data for the alert.
- Action: Inspect sensors for physical damage, loose connections, or calibration drift. Ensure they are installed correctly as per manufacturer specifications [4].
- Action: Confirm that sensors are capturing data continuously and at a sufficient frequency. Intermittent data can miss critical anomalies [4].
- Audit the AI Model's Baseline: Anomaly detection algorithms require a clear baseline of "normal" equipment operation to identify "abnormal" behavior accurately.
- Action: Review the data used to train the model. Ensure it includes enough information from both healthy operation and known failure modes. If failure data is scarce, techniques like Failure Mode Effects Analysis (FMEA) can be used to simulate it [4].
- Implement Explainable AI (XAI): A system that provides a clear rationale for its diagnoses empowers engineers to verify the alert.
- Action: If your PdM vendor offers it, utilize XAI features. For example, FutureMain's ExRBM system clearly presents the basis of each diagnosis, allowing field engineers to make more reliable decisions and distinguish between a sensor glitch and a genuine mechanical issue [5].
Guide 2: Addressing Poor User Adoption Among Technical Staff
Symptoms: Maintenance technicians and researchers ignore system alerts, bypass new procedures, or express skepticism about the PdM system's value.
Diagnosis and Resolution:
- Address the Root Causes of Resistance: Resistance often stems from fear of job displacement, distrust of complex "black box" algorithms, or a perception that the new system adds extra work [3].
- Action: Communicate transparently that PdM is a tool to augment expertise, not replace personnel. Frame it as a way to eliminate tedious emergency repairs and empower staff to work more strategically [3].
- Provide Hands-On, Role-Specific Training: Generic training is insufficient.
- Demonstrate Early Wins: Build confidence by showcasing success.
- Action: Publicize cases where the PdM system successfully predicted a fault and allowed for a planned intervention that saved a critical research project from disruption. Use these stories to build institutional buy-in [6].
Experimental Protocols for Predictive Maintenance
Protocol 1: Validating a Predictive Maintenance Model for a Plant Growth Chamber
Objective: To design and validate a predictive maintenance model that can predict failures in the refrigeration system of a plant growth chamber with at least 4 weeks of lead time.
Background: The refrigeration system is critical for maintaining precise temperature settings. Its failure would directly compromise experimental conditions and plant viability [1].
Materials and Reagents:
| Research Reagent Solution | Function in Protocol |
|---|---|
| Vibration Sensors | To monitor the compressor and condenser fans for abnormal oscillations that indicate imbalance, misalignment, or bearing wear [4] [7]. |
| Temperature Sensors | To track discharge and suction line temperatures; anomalous trends can signal refrigerant issues or reduced efficiency [4] [7]. |
| Electrical Power Monitors | To analyze the current draw of the compressor motor; increasing amperage can indicate mechanical overload or winding issues [7]. |
| Data Acquisition System | A platform (e.g., IIoT software) to collect, aggregate, and time-stamp sensor data for analysis [4]. |
| AI/ML Analytics Platform | Software capable of running machine learning algorithms (e.g., LSTM networks) to establish baselines and detect anomalies from the multi-sensor data [7]. |
Methodology:
- Baseline Data Collection: Over a period of 3 months, operate the growth chamber under standard experimental profiles while collecting continuous, high-frequency data from all sensors. This data will define the "healthy" operational signature [4].
- Feature Engineering: Extract relevant features from the raw data, such as vibration frequency spectra, temperature differentials, and motor power factor.
- Model Training: Use the baseline data to train a machine learning model (e.g., an LSTM network) to recognize the normal operational patterns. The model will learn to flag significant deviations from this baseline [7].
- Model Validation and Deployment:
- Historical Validation: Test the model against historical data from a past compressor failure to see if it would have generated a timely alert.
- Live Deployment: Implement the model in a live monitoring environment.
- Performance Metric: The model will be considered validated if it triggers an alert that leads to a confirmed fault finding upon inspection, and does so with at least 80% accuracy and a lead time of 4 weeks before projected functional failure.
The workflow for this experimental protocol is outlined below.
Protocol 2: Computer Vision for Monitoring Laboratory Equipment
Objective: To implement a non-contact, computer vision-based predictive maintenance system for a dissolution tester, ensuring its rotational speed and wobble remain within calibrated tolerances.
Background: In pharmaceutical labs, dissolution testers must be perfectly calibrated. Manual observation is unreliable, and miscalibration can invalidate drug testing results, leading to costly experiment repetition and compliance issues [8].
Materials and Reagents:
| Research Reagent Solution | Function in Protocol |
|---|---|
| High-Speed Camera (Visual Sensor) | To capture live video footage of the dissolution apparatus in operation, providing a frame-by-frame visual data stream [8]. |
| Computer Vision Software | A program developed using AI and deep learning libraries (e.g., OpenCV, TensorFlow) to analyze the video feed [8]. |
| Calibration Dashboard | A user-friendly interface to display the real-time status (Correct/Incorrect) of the machine and alert users to anomalies [8]. |
Methodology:
- Data Acquisition: Record video footage of the dissolution tester operating in both a known "correct" state and various "incorrect" states (e.g., introduced speed variations, off-axis wobble).
- Algorithm Development: Train a deep learning model to analyze the video frames. The model will learn to quantify key parameters:
- Rotation Speed: Calculated by tracking visual features frame-to-frame.
- Wobbling (Deviation): Measured by analyzing the axis of rotation for any deviation from the true center.
- Threshold Setting: Establish acceptable thresholds for speed and wobble based on manufacturer specifications and regulatory requirements.
- Deployment and Alerting: Integrate the camera and software for live monitoring. The system must automatically alert lab personnel via the dashboard when the machine's operation drifts outside the set tolerances, prompting immediate calibration [8].
The logical relationship of this computer vision system is as follows:
The Stark Reality: Quantifying Downtime Costs
For research and drug development laboratories, equipment failure is not a mere inconvenience; it is a critical threat to data integrity, project timelines, and financial resources. The following table summarizes the documented financial impact of unplanned downtime across various sectors, including life sciences.
| Context | Reported Cost of Unplanned Downtime | Source / Frequency |
|---|---|---|
| General Life Sciences Lab | $1,000 - $10,000 per hour (depending on experiment and sample value) [9] | Thermo Fisher Scientific Estimate |
| Specialized Life Sciences Applications | Up to $200,000+ per hour [9] | 2024 Industry Analysis |
| Labs Experiencing Unplanned Downtime | 43% quarterly; Over 20% monthly [9] | 2021 Lab Manager Magazine Report |
| Global Manufacturing | Over $1 trillion annually [9] | Recent Siemens Study |
| Fortune Global 500 Manufacturers | Average of $129 million per facility annually [9] | Industry Report |
Beyond these direct financial losses, downtime in pharmaceutical and biotech research carries unique risks:
- Compromised Product Integrity: Sudden halts can disrupt critical environmental controls, affecting the safety, efficacy, and sterility of pharmaceuticals in production [10].
- Ripple Effects on Healthcare: Disruptions in the pharma supply chain can delay the availability of essential medicines, vaccines, and prescription drugs, impacting public health [10].
- Data Integrity and Lost Research: Failed experiments due to equipment malfunction can invalidate months of work, setting back drug discovery pipelines and potentially causing irreplaceable sample loss.
The Researcher's Toolkit: Essential Maintenance & Monitoring Solutions
Implementing a strategic maintenance program requires specific tools and approaches. The table below outlines key methodologies and their functions in a research context.
| Solution / Methodology | Primary Function in Research |
|---|---|
| Predictive Maintenance | Uses sensor data and AI analytics to predict equipment failures before they occur, allowing for scheduling repairs during planned, non-critical times [11] [12]. |
| Preventive Maintenance (PM) | Involves performing regular, scheduled inspections and maintenance tasks to detect and prevent equipment failures based on time or usage intervals [10] [12]. |
| Computerized Maintenance Management System (CMMS) | A software platform that provides a structured approach to managing maintenance schedules, work orders, and spare parts inventory, facilitating informed decision-making [13]. |
| IoT Sensors | Devices installed on equipment to collect real-time performance data (e.g., temperature, vibration, pressure) for continuous condition monitoring [11]. |
| Integrated Pest Management (IPM) | A strategy combining mechanical, physical, and biological controls to prevent and manage pest and disease outbreaks in plant growth facilities, reducing reliance on chemical pesticides [14]. |
Troubleshooting Guide: FAQs for Plant Growth Equipment
Q1: My growth chamber temperatures are fluctuating outside the optimal range. What should I check?
Temperature instability is a common issue that can stress plants and invalidate research data. Follow this systematic protocol to identify the root cause.
Experimental Monitoring Protocol:
- Tools Required: Digital data-logging thermometer, hygrometer.
- Methodology: Place the logger at the plant canopy level within the growth chamber. Record temperature and humidity at 5-minute intervals for a minimum of 72 hours to capture full light/dark cycles and identify patterns [14] [15].
- Optimal Ranges: While plant-specific, general targets are a daytime temperature of 25–30°C (77–86°F) and a nighttime temperature around 21°C (70°F) [14].
Q2: The artificial lighting on my growth rack is flickering, or some LEDs have stopped working. How do I troubleshoot this?
Lighting issues can directly affect plant morphology and physiology. This workflow helps diagnose common problems.
Key Considerations:
- Safety First: Always power off and unplug the unit before performing any physical inspection to avoid electrical shock [16].
- Corrosion: In high-humidity environments, light corrosion is a risk. Ensure your growth room lights have an appropriate IP rating (e.g., IP54 or higher for moisture protection) [16].
- Light Intensity: Use a light meter to measure Photosynthetic Photon Flux Density (PPFD) at the canopy after any repair to ensure intensity matches your experimental protocol [15].
Q3: My plants are showing signs of pest infestation. What is the integrated pest management (IPM) approach?
Pests can introduce uncontrolled variables and destroy research samples. An IPM strategy is critical.
Detailed IPM Methodology:
- Set Action Thresholds: Determine the pest population level at which action is required to prevent unacceptable harm [14].
- Monitor and Identify: Manually scout plants and use yellow sticky traps for early detection and accurate pest identification (e.g., aphids, spider mites, thrips) [14] [15].
- Prevent Outbreaks:
- Maintain Optimal Humidity (typically 40-60%) to discourage pests [15].
- Ensure good air circulation with intake and exhaust fans to prevent stagnant, pest-friendly conditions [14] [15].
- Quarantine new plants before introducing them to main growth areas [15].
- Prioritize lab hygiene, including handwashing and the use of sticky mats to prevent pathogen entry [14].
- Implement Non-Chemical Controls First:
Implementing a Predictive Maintenance Framework
Moving from reactive troubleshooting to a proactive, predictive framework is the most effective way to safeguard your research.
The Predictive Maintenance Workflow
The following diagram illustrates the continuous cycle of data-driven equipment management.
Experimental Protocols for Implementation:
Phase 1: Sensor Deployment & Baseline Establishment
- Materials: IoT sensors for vibration, temperature, humidity; data acquisition platform.
- Protocol: Install sensors on critical equipment (e.g., environmental chamber compressors, HVAC systems, light ballasts). Operate equipment under known normal conditions for a set period to collect baseline performance data [11].
Phase 2: Anomaly Detection & Alert Configuration
- Materials: CMMS or analytics software, AI/machine learning algorithms.
- Protocol: Train machine learning models on the historical baseline data to recognize normal operating patterns. Configure the system to generate alerts when real-time sensor data (e.g., unusual vibration, temperature drift) deviates from the established baseline, indicating a potential failure [11].
Phase 3: Controlled Validation Trial
- Methodology: Conduct a controlled trial where the predictive system's alerts are compared against a control group maintained on a traditional preventive schedule. Use yield data, equipment failure logs, and third-party lab results to validate the accuracy of predictions and quantify the reduction in unplanned downtime [14].
Technical Support Center
Troubleshooting Guides
Troubleshooting Guide 1: Resolving Data Anomalies in Prognostic Models
Problem: The predictive model for equipment remaining useful life (RUL) is generating inconsistent or anomalous predictions.
| Step | Action | Expected Outcome |
|---|---|---|
| 1 | Verify data quality from IoT sensors [17] | Confirm sensor data is within expected operational ranges |
| 2 | Recalibrate sensor selection using pseudo-label-based methods [17] | Ensure only degradation-related sensors are included |
| 3 | Validate ensemble model inputs (SVR, GPR, state-space models) [17] | Confirm all model components receive properly formatted data |
| 4 | Check for background computational processes affecting analysis | System resources are properly allocated to prognostic tasks |
Resolution: Implement sensor recalibration and model validation protocol. For persistent issues, consult the computational resource allocation checklist.
Troubleshooting Guide 2: Addressing Plant Health False Positives in Monitoring Systems
Problem: The system indicates plant health issues that visual inspection cannot confirm.
| Step | Action | Expected Outcome |
|---|---|---|
| 1 | Verify environmental sensor calibration (temperature, humidity, light) [14] | Confirm sensors report accurate readings within ±2% tolerance |
| 2 | Check nutrient delivery system EC and pH levels [14] | Confirm pH between 5.8-6.3 and proper electrical conductivity |
| 3 | Inspect root zone for signs of pathogens or rot [18] | Identify any visible root discoloration or degradation |
| 4 | Review historical data patterns for similar anomalies | Determine if issue represents actual change or sensor drift |
Resolution: Recalibrate environmental control systems and verify nutrient solution composition. Implement enhanced manual scouting protocol.
Frequently Asked Questions (FAQs)
What key performance indicators should we track to measure predictive maintenance effectiveness? Measure the number of "find it first" anomalies detected and corrected, reliability improvement through reduction in unexpected failures, and equipment life extension. These KPIs reflect the true value of predictive maintenance in research environments [19].
How long does it take to establish an IoT-enabled predictive maintenance program? Basic sensor network implementation requires approximately one week for straightforward installations. Projects involving network security configurations, firewall adjustments, or custom communication networks may extend to several weeks. A pilot program approach is recommended before full-scale implementation [19].
What is the typical accuracy we can expect from degradation trend predictions? Implemented systems have demonstrated mean square error of 0.0004 in degradation trend prediction and less than 1.7% error in remaining useful life prediction for critical equipment like circulating water pumps [17].
How can we identify when predictive maintenance is being performed too frequently? Predictive maintenance is excessive when the cost of execution and analysis exceeds the demonstrated benefit. Reference the 6:1 rule, which states that maintenance inspections should reveal corrective work needs approximately every sixth inspection on average [19].
Does predictive maintenance work by AI or statistical analysis? Modern systems increasingly utilize both. While traditional limits-based alarms use statistics, more intelligent systems employ pattern recognition and complex data analysis. AI and machine learning are becoming more common, though they require time to learn from historical data [19].
Experimental Protocols & Data Presentation
Quantitative Performance Data
Table 1: Predictive Maintenance System Performance Metrics [17]
| Metric | Performance Value | Application Context |
|---|---|---|
| Degradation Trend Prediction MSE | 0.0004 | Circulating water pump in nuclear power plant |
| RUL Prediction Error | <1.7% | High-end equipment with limited degradation knowledge |
| Sensor Selection Computational Cost | Significant reduction | Pseudo-label-based method with online monitoring data |
Table 2: Optimal Environmental Parameters for Research Plant Growth [14]
| Parameter | Target Range | Impact on Research Consistency |
|---|---|---|
| Daytime Temperature | 25-30°C (77-86°F) | Metabolic process regulation |
| Nighttime Temperature | ~21°C (70°F) | Respiration control |
| Relative Humidity | Stage-dependent (e.g., 75% at 25°C) | Vapor pressure deficit management |
| Water Temperature | 65-75°F | Optimal root zone oxygenation |
| pH Level | 5.8-6.3 | Nutrient availability optimization |
Experimental Methodology
Protocol 1: Degradation Trend Prediction for Critical Research Equipment
Objective: Establish reliable short-term prognosis for equipment health under limited degradation knowledge.
Materials:
- IoT sensors for vibration, temperature, and performance parameters
- Data acquisition system with appropriate sampling frequency
- Computational resources for ensemble modeling
Procedure:
- Collect equipment performance data from installation to present [17]
- Implement pseudo-label-based sensor selection to identify degradation-related sensors [17]
- Apply ensemble model combining structured state-space sequence model, support vector regression (SVR), and Gaussian process regression (GPR) [17]
- Validate model predictions against subsequent equipment performance
- Refine model parameters based on prediction accuracy
Expected Outcome: High-accuracy short-term prognosis enabling scheduled maintenance during non-critical research periods.
Protocol 2: Plant Health Anomaly Detection in Controlled Environments
Objective: Early identification of plant health issues that could compromise research validity.
Materials:
- Environmental sensors (temperature, humidity, CO₂, light intensity)
- Nutrient solution monitoring system (EC, pH, dissolved oxygen)
- Automated imaging system for plant phenotyping
- Data integration platform
Procedure:
- Establish baseline environmental parameters for specific plant genotypes [14]
- Implement continuous monitoring with threshold-based alerts [14]
- Conduct daily manual scouting to verify automated system readings [14]
- Document all anomalies with correlated environmental data
- Perform root cause analysis for confirmed plant health issues
Expected Outcome: Reduced experimental variance due to undetected plant health issues and improved research reproducibility.
The Scientist's Toolkit
Table 3: Essential Research Reagent Solutions for Predictive Maintenance Implementation
| Item | Function | Application Specifics |
|---|---|---|
| IoT Sensor Arrays | Continuous equipment condition monitoring [11] | Vibration, temperature, pressure, and performance metrics |
| CMMS Software | Maintenance workflow coordination and data management [20] | Tracks asset history and generates maintenance work orders |
| Vibration Analysis Tools | Detect mechanical defects and imbalances [20] | Identifies bearing wear, misalignment, and resonance issues |
| Oil Analysis Kits | Lubricant condition monitoring [20] | Detects contaminants and additive depletion in critical systems |
| Acoustic Monitoring Equipment | Early failure detection through sound pattern analysis [20] | Identifies cavitation, leaks, and abnormal mechanical noises |
| Data Analytics Platform | Machine learning implementation for pattern recognition [17] [11] | Runs SVR, GPR, and other prognostic algorithms |
| Environmental Sensors | Growth chamber parameter verification [14] | Monitors temperature, humidity, CO₂, and light intensity |
| Nutrient Solution Testers | Macronutrient and pH level validation [14] | Ensures consistent plant nutrition across experimental groups |
System Workflow Diagrams
Predictive Maintenance Implementation Workflow
Anomaly Diagnosis and Response Protocol
Troubleshooting Guides
Guide 1: Resolving Poor Data Quality from IoT Sensors
Problem: Predictive models for a climate control system's compressor are generating inconsistent alerts and unreliable failure predictions. The incoming sensor data appears noisy or contains gaps.
Diagnosis: Inconsistent or missing data from IoT sensors leads to inaccurate machine learning model outputs. In a research environment, this can compromise experimental integrity by causing unplanned climatic deviations.
Solution:
- Verify Sensor Calibration: Ensure all sensors (temperature, vibration, humidity) are properly calibrated against known standards. Re-calibrate according to the manufacturer's schedule.
- Inspect Data Pipelines: Check the entire data flow path—from sensor to gateway to database—for connectivity issues or service interruptions that cause data loss. Implement a "heartbeat" signal to monitor sensor health.
- Apply Data Preprocessing: Use the following methodology to clean your data before it is used for analysis [21]:
- Handle Missing Values: For short gaps, use forward-filling to propagate the last valid observation. For larger gaps, employ a rolling average to impute missing values and maintain data trends [21].
- Detect and Remove Outliers: Use graphical methods like box plots alongside algorithmic approaches like K-Nearest Neighbors (KNN) to identify and filter out anomalous readings based on predefined, equipment-specific thresholds [21].
- Conduct Root Cause Analysis: If a specific sensor consistently produces erratic data, physically inspect it for damage, environmental exposure, or power supply issues.
Guide 2: Addressing False Positives in AI Failure Alerts
Problem: The AI system for a hydroponic water pump is triggering frequent failure alerts, but physical inspection reveals no fault. This "alert fatigue" leads to ignored critical warnings.
Diagnosis: The model's alert thresholds are likely too sensitive or were trained on data that does not represent the full range of normal operating conditions for your specific equipment.
Solution:
- Review and Relabel Data: Manually review historical data that triggered false alarms and confirm its "normal" status. Use this relabeled data to retrain your model.
- Incorporate Operational Context: Integrate operational data into your model. For example, a transient increase in motor vibration might be normal during a pump's startup phase but critical during steady-state operation. Engineering features like
is_startupcan help the model learn these contexts [21] [22]. - Optimize Alert Thresholds: Adjust the probability threshold for failure alerts. Increase it slightly to reduce false positives, but balance this against the risk of missing a true positive. This is an iterative process.
- Implement Multi-Sensor Fusion: Do not rely on a single data source. Combine inputs from vibration, temperature, and acoustic sensors. A genuine failure is more likely when multiple sensors detect anomalies simultaneously, which can increase detection accuracy to over 95% [23].
Guide 3: Integrating PdM Systems with Existing Research Equipment
Problem: Researchers struggle to connect new IoT and AI-based predictive maintenance systems with legacy plant growth chambers and environmental control systems.
Diagnosis: Legacy equipment often lacks modern data ports or uses proprietary communication protocols, creating integration siloes.
Solution:
- Assess Connectivity Options:
- Retrofit Sensors: Install external, self-powered IoT sensors (for vibration, temperature, etc.) directly onto the critical equipment. These sensors can transmit data via wireless protocols like 5G, which is ideal for high-density sensor networks [7].
- Leverage SCADA/PLC: If available, connect to the equipment's existing Programmable Logic Controller (PLC) or Supervisory Control and Data Acquisition (SCADA) system to extract operational data [21] [24].
- Utilize Edge Computing: Deploy an edge computing device to collect data from various sources and protocols. This device can preprocess the data, handle protocol translation, and reduce latency by performing initial analysis locally before sending insights to the cloud [7].
- Build a Unified Data Platform: Use a cloud or on-premise data platform (e.g., AWS IoT, Azure IoT) to act as a central hub for all equipment data. This platform normalizes data formats, making it usable for AI models [25] [26].
- Adopt a Phased Implementation: Start with a pilot project on one or two critical assets, such as a primary growth chamber's cooling system. This proves the value and provides a blueprint for scaling to other equipment [23] [24].
Frequently Asked Questions (FAQs)
Q1: What is the most significant benefit of implementing predictive maintenance in a research context? The primary benefit is the drastic reduction of unplanned downtime, which can be reduced by up to 50% [23] [24]. In plant growth research, an unexpected equipment failure can compromise months of experimental work by altering critical environmental conditions. Predicting failures allows for maintenance to be scheduled during planned intervals, protecting the integrity of long-term studies.
Q2: We have a limited budget. What is a realistic initial investment for a predictive maintenance system? Investment can be phased. A basic vibration monitoring system for a few critical assets can start in the range of \$15,000 - \$45,000, with a payback period of 8-14 months achieved through avoided downtime [23]. The key is to start with a pilot project on high-impact equipment to demonstrate ROI before scaling up.
Q3: Which sensors are most critical for monitoring plant growth equipment like HVAC, lights, and water pumps? The most common and critical sensors are:
- Vibration sensors: For motors in pumps, compressors, and fans to detect bearing wear and imbalance [7] [27].
- Temperature sensors: For thermal management systems and electrical components to prevent overheating [7] [21].
- Current/power draw sensors: To identify electrical faults and inefficiencies in lighting systems and pumps [22] [27]. These three parameters are highly effective at providing early warnings for most mechanical and electrical failures [27].
Q4: What is the role of Machine Learning in predictive maintenance? Machine Learning transforms raw sensor data into actionable predictions. Key applications include:
- Anomaly Detection: Identifying deviations from normal equipment behavior [22] [28].
- Remaining Useful Life (RUL) Prediction: Forecasting the expected time before a component fails [22] [28].
- Pattern Recognition: Finding complex correlations between operating conditions and failure modes that are impossible to spot with manual monitoring [22] [27].
Q5: What are the common types of predictive maintenance models? There are three main types, each with different outputs [28]:
- Anomaly Detection: Flags when equipment operation deviates from a learned "normal" baseline.
- Indirect Failure Prediction: Calculates a machine health score based on operating conditions and history.
- Remaining Useful Life (RUL): Provides a time-window estimate for when a component will likely fail. RUL is the most complex but also the most informative for planning.
Table 1: Operational and Financial Impact of Predictive Maintenance
| Metric | Impact Range | Source |
|---|---|---|
| Reduction in Unplanned Downtime | 35% - 50% | [7] [23] |
| Reduction in Maintenance Costs | 25% - 30% | [7] [24] |
| Increase in Equipment Lifespan | 20% - 40% | [23] [24] |
| ROI Payback Period | 8 - 22 months (depending on system complexity) | [23] |
Table 2: AI Model Performance in Predictive Maintenance
| Model Function | Performance / Accuracy | Source |
|---|---|---|
| Failure Prediction Accuracy | Up to 90% | [7] |
| Anomaly Detection for False Alarm Reduction | 30% reduction in false alarms | [7] |
| Advanced Multi-Sensor Fusion Detection | 85% - 95% accuracy | [23] |
Experimental Protocol: Developing a Predictive Model for Equipment Failure
This protocol outlines the methodology for creating a machine learning model to predict failures in critical plant growth equipment, such as a water circulation pump, based on a real-world industrial case study [21].
1. Objective: To develop a model that predicts pump failure 3-7 days in advance with at least 85% accuracy.
2. Data Collection & Preprocessing:
- Sensor Setup: Install wireless vibration (x, y, z-axis) and temperature sensors on the pump motor housing. Data should be collected at a high frequency (e.g., every 5 seconds) [21].
- Data Sources: Integrate sensor data with operational logs from the SCADA or control system, noting periods of high load (startup/shutdown) [21].
- Data Duration: Collect data over a period that includes several normal operating cycles and at least one documented failure event to create a robust dataset [21].
- Data Cleaning:
- Handle Missing Data: For short gaps, use forward-filling. For larger gaps, use a rolling mean [21].
- Outlier Removal: Use the K-Nearest Neighbors (KNN) method and box plots to identify and remove sensor readings that fall outside realistic thresholds [21].
- Normalization: Apply Min-Max scaling to bring all sensor data to a common scale [21].
3. Feature Engineering: Create new input features from the raw data to improve model performance:
- Temporal Features:
hour_of_day,day_of_week,is_weekendto account for cyclical patterns [21]. - Statistical Features: Calculate
moving_averageandrolling_standard_deviationfor vibration and temperature over short windows (e.g., 10 minutes) to capture trends [21]. - Labeling: Label historical data points with a "failure" flag for the 7-day period preceding a known failure.
4. Model Training & Selection:
- Split the processed data into training and testing sets (e.g., 80/20).
- Train and compare multiple algorithms, such as:
- Select the best-performing model based on metrics like precision, recall, and F1-score on the test set.
5. Deployment & Monitoring:
- Deploy the model for real-time inference on an edge device or cloud platform.
- Integrate alerts into a maintenance management system or researcher dashboard.
- Continuously monitor the model's performance and retrain it periodically with new data to prevent accuracy decay.
System Architecture and Workflow
PdM System Data Flow
The Scientist's Toolkit: Research Reagent Solutions
Table 3: Essential Tools and Platforms for PdM Implementation
| Tool Category | Example Solutions | Function in PdM Research |
|---|---|---|
| Vibration Sensors | Wireless Accelerometers (e.g., from SPI, Analog Devices) | Capture high-frequency mechanical oscillations to detect bearing wear, imbalance, and misalignment in motors [7] [27]. |
| Thermal Sensors | Infrared Thermometers, PT100 RTDs | Monitor surface temperature of electrical components and motors to identify overheating due to friction or electrical faults [7] [23]. |
| Data Acquisition & Edge Platform | Raspberry Pi, Arduino, Siemens SIMATIC IOT2000, PDX DAQ [28] | Acts as a local gateway to collect, preprocess, and synchronize data from multiple sensors before transmission [7] [28]. |
| Cloud AI & Analytics Platforms | Google Cloud AI, Azure Machine Learning, AWS IoT [25] | Provides scalable computing power for developing, training, and deploying machine learning models on large datasets [25] [26]. |
| Predictive Maintenance Software | IBM Maximo, Aveva PI System, Falkonry Workbench [28] | Specialized software offering pre-trained models, data visualization, alerting, and integration with maintenance systems [28]. |
In the specialized field of plant growth equipment research, where experimental integrity depends on precise environmental control, unplanned equipment failure can compromise months of data. Predictive maintenance (PdM) transforms facility management from a reactive to a proactive, data-driven discipline [29]. The global predictive maintenance market, valued at $5.5 billion in 2022, is growing at an estimated 17% annually, underscoring its critical role in modern industrial operations [28]. This technical support center outlines the three core types of predictive maintenance—Anomaly Detection, Indirect Failure Prediction, and Remaining Useful Life (RUL)—providing researchers with practical guides and FAQs for implementation.
Understanding the Three Types of Predictive Maintenance
The table below summarizes the three main predictive maintenance approaches, their objectives, and their applicability to plant growth research.
| Type | Core Objective | Primary Methods | Best for Plant Research Scenarios |
|---|---|---|---|
| Anomaly Detection [28] [29] | Identify deviations from established "normal" equipment behavior. | Unsupervised Machine Learning (e.g., Autoencoders, Principal Component Analysis) [28] [30]. | Detecting novel or unforeseen faults in growth chambers (e.g., unusual vibration in compressor, subtle temperature drift). |
| Indirect Failure Prediction [28] [29] | Generate a machine health score based on operational data to assess failure risk. | Supervised Machine Learning (e.g., Decision Trees, Gradient Boosting) [29]; Rule-based systems using manufacturer specs [28]. | Scalable monitoring of multiple assets like LED grow lights and nutrient pumps to prioritize maintenance attention. |
| Remaining Useful Life (RUL) [17] [28] [29] | Estimate the exact time or cycles before a component fails. | Regression Models (e.g., Linear Regression, SVR, GPR), Deep Learning (e.g., LSTM) [17] [29]. | Planning critical component replacements (e.g., HVAC filters, UV bulbs in sterilizers) during natural experiment downturns. |
Experimental Protocols & Methodologies
Protocol 1: Implementing Anomaly Detection for an Environmental Growth Chamber
This protocol is designed to detect unforeseen faults in a critical piece of equipment like an environmental growth chamber.
1. Problem Definition: Unplanned fluctuations in temperature or humidity within a growth chamber can invalidate experimental results on plant phenotype.
2. Data Collection & Sensor Setup:
- Sensors: Install vibration sensors on the chamber's compressor and condenser fans. Use existing temperature and humidity sensors for process data [30].
- Data Layer: Configure an IoT gateway to collect time-series data from all sensors at 1-minute intervals, transmitting it to a central database [17] [29].
3. Model Training & Baseline Establishment:
- During a known "healthy" operational period (e.g., 4-6 weeks), collect data to establish a baseline [30].
- Use an unsupervised learning algorithm like an Autoencoder to learn the pattern of normal operation without being told what a fault looks like [28]. The model will learn to reconstruct normal sensor readings with minimal error.
4. Deployment & Alerting:
- Deploy the trained model to analyze real-time incoming data.
- Set a threshold on the model's reconstruction error. When the error exceeds this threshold, it indicates the sensor data pattern can no longer be accurately reconstructed, signaling an anomaly [30].
- Configure the system to trigger an alert in the laboratory's CMMS or alerting platform [29].
The workflow for this protocol is outlined below.
Protocol 2: Estimating Remaining Useful Life (RUL) for a Nutrient Pump
This protocol provides a methodology for predicting the exact failure point of a degrading component.
1. Problem Definition: Peristaltic nutrient pumps in an automated feeding system experience wear on tubing and motor assemblies, leading to gradual flow rate decay.
2. Data Collection & Feature Engineering:
- Sensors: Monitor motor current, housing temperature, and output pressure. Use a flow meter to capture the actual flow rate as the ground-truth health indicator [17].
- Feature Engineering: As the pump degrades, features like motor current variance and operating temperature will typically increase. Create a "health index" that starts at 1 (new) and trends toward 0 (failure), often directly correlated with the decaying flow rate [28].
3. Model Selection and Training:
- This is a regression problem. Suitable models include Support Vector Regression (SVR), Gaussian Process Regression (GPR), or Long Short-Term Memory (LSTM) networks for capturing temporal patterns [17] [29].
- Train the model on historical run-to-failure data. If such data is scarce (a common challenge), use an empirical degradation model informed by short-term prediction results from the ensemble model in the previous step [17].
4. RUL Prediction & Deployment:
- The model takes current and historical sensor data as input and outputs the Estimated RUL (e.g., "48 ± 5 hours of operation remaining") [28].
- Integrate this prediction with a CMMS to automatically generate a work order when the RUL falls below a predefined threshold, scheduling maintenance before the pump fails during a critical growth cycle [29].
The logical flow for this prognostic process is as follows.
The Scientist's Toolkit: Research Reagent Solutions
The table below details key hardware and software components essential for setting up a predictive maintenance research platform.
| Item | Function in PdM Research |
|---|---|
| IoT Vibration/Temperature Sensor [29] [30] | Captures physical parameters indicative of mechanical stress (e.g., in pumps, fans). Data is used for anomaly detection and RUL models. |
| Data Acquisition (DAQ) Gateway [29] | Aggregates, time-synchronizes, and transmits sensor data from multiple sources to a central analysis platform. |
| Computerized Maintenance Management System (CMMS) [31] [32] | The central software for logging maintenance history, managing work orders generated by PdM alerts, and tracking asset reliability. |
| Predictive Analytics Software [28] [33] | Platform containing libraries for building, training, and deploying machine learning models (e.g., for anomaly detection or RUL estimation). |
| IO-Link Sensor [30] | A smart sensor that provides multiple data points and detailed diagnostic information (e.g., internal temperature, signal strength) from a single device, enriching datasets. |
Troubleshooting Guides & FAQs
- Symptom: The model generates excessive false alarms, causing technicians to ignore alerts.
- Check: Investigate Data Quality and Class Imbalances.
- Solution:
- Validate Sensor Accuracy: Recalibrate sensors to ensure they reflect the true state of the equipment [33].
- Address Class Imbalance: Use techniques like SMOTE (Synthetic Minority Over-sampling Technique) to artificially generate examples of rare failure events in your training data [33].
- Review Model Evaluation Metrics: Move beyond simple accuracy. Use metrics like Precision and Recall to better understand the model's performance in predicting failures [33].
- Symptom: Low utilization of the PdM software; technicians revert to old, reactive habits.
- Check: Assess the level of Organizational Buy-in and Training.
- Solution:
- Secure Early Buy-in: Communicate the benefits to all stakeholders before implementation. Show how PdM makes their jobs easier by preventing emergency breakdowns [30].
- Develop Comprehensive Training: Train users not just on the tool, but on the reason for the new strategy and how to interpret its alerts [30].
- Start with a Pilot Project: Begin with a small, high-value asset to demonstrate quick ROI and build confidence before scaling [3] [30].
- Symptom: Inability to create accurate models, especially for RUL or failure prediction.
- Check: Evaluate data for Insufficient Baseline or Failure Information.
- Solution:
- Leverage Anomaly Detection: Start with unsupervised models that only require "normal" operation data, bypassing the need for failure examples [28].
- Simulate Failure Data: Use engineering tools like Failure Mode and Effects Analysis (FMEA) to systematically adjust healthy sensor data and simulate failure scenarios for model training [30].
- Use Ensemble Models: Combine models like Structured State-Space, SVR, and GPR for short-term prognosis, which can then inform long-term RUL estimates even with limited data [17].
The following decision tree can guide the resolution of these common issues.
Building Your Predictive Maintenance System: Sensors, Data, and Algorithms
FMEA and Predictive Maintenance Fundamentals
What is Failure Mode and Effects Analysis (FMEA) in the context of plant growth equipment research? FMEA is a systematic, step-by-step methodology for identifying and prioritizing all potential failures in a system, design, process, or service [34] [35]. For research involving plant growth chambers, climate-controlled greenhouses, or hydroponic systems, FMEA provides a proactive framework to anticipate equipment failures that could compromise experimental integrity, lead to data loss, or cause plant mortality. The primary goal is to mitigate or eliminate these potential failures before they occur [34].
How does FMEA integrate with a Predictive Maintenance strategy? FMEA is the foundational risk assessment step that informs a Predictive Maintenance program. FMEA identifies what can fail and why, while Predictive Maintenance uses real-time equipment monitoring to determine when a failure is likely to happen [36]. This synergy allows researchers to move from rigid, time-based maintenance schedules to a condition-based approach, ensuring maintenance is performed only when necessary and thereby reducing unnecessary interventions and preventing unexpected breakdowns [36].
Troubleshooting Guide: FMEA FAQs
FAQ 1: We are commissioning a new plant growth chamber. What is the most common mistake in initial failure mode identification? A common mistake is overlooking "Infant Mortality" failures. Research on equipment failure patterns shows that a significant percentage of assets experience high failure rates at the beginning of their lifecycle due to design flaws, manufacturing defects, or improper installation [36] [37]. For a new growth chamber, this could include faulty sensor calibration, software bugs in the environmental controller, or improper sealing on doors.
- Protocol for Mitigation: Implement a rigorous commissioning and burn-in protocol. During the first 100-200 hours of operation, monitor key parameters (temperature, humidity, CO₂, light intensity) more frequently—perhaps every 4-8 hours—against independent, calibrated measurement devices to identify and correct early-life failures.
FAQ 2: Our nutrient dosing system fails unpredictably, disrupting long-term studies. How can FMEA help? This describes a "Random Failure" pattern, which studies indicate can account for 11% to 36% of equipment failures [36] [37]. These failures are not age-related and are often induced by external factors. An FMEA helps by forcing a structured analysis of all potential root causes.
- Protocol for Mitigation:
- Identify Root Causes: Use a "5 Whys" analysis or a Fishbone (Ishikawa) diagram [35]. Potential causes could be power surges, software glitches, particulate matter clogging solenoid valves, or variations in water pressure.
- Develop Mitigation Strategies: Based on the root causes, strategies may include installing uninterruptible power supplies (UPS), updating firmware, adding in-line water filters, or implementing pressure-regulating valves.
FAQ 3: The UV lamps in our imaging system are replaced on a fixed schedule, but some fail early and others last much longer. Why? This indicates that the UV lamps likely follow a failure pattern with no strong correlation to age (a "Random" or "Infant Mortality" pattern) [37]. Time-based replacement is only effective for the ~9% of failures that are truly age-related (showing a "Wear-Out" curve) [36] [37]. You are likely replacing many lamps that still have useful life remaining.
- Protocol for Mitigation: Transition to a condition-based monitoring approach. Track the light intensity output of the lamps regularly. Use FMEA to determine a failure effect (e.g., "light intensity drops below 95% of setpoint") and a severity rating. A Predictive Maintenance system would alert you when the measured intensity degrades to a threshold, signaling the need for replacement.
FMEA Data and Failure Patterns
Table 1: Equipment Failure Patterns and Research Implications
| Failure Pattern | Description | Prevalence | Example in Plant Research Equipment | Recommended Strategy |
|---|---|---|---|---|
| Bathtub Curve (A) | High initial failure, then low random failure, then sharp wear-out increase. | ~4% [36] | Newly installed CO₂ sensor with early calibration drift; wear-out of a compressor in a refrigeration unit. | Rigorous commissioning; proactive replacement near end of life. |
| Wear-Out (B) | Low random failure followed by a sharp wear-out increase. | ~2% [37] | Mechanical shutter in a photoperiod control system. | Proactive replacement based on usage cycles. |
| Gradual Wear-Out (C) | Slow, gradual increase in failure probability over time. | ~5% [37] to ~47% [36] | Gradual fogging of glass in a growth chamber; scaling in hydroponic water lines. | Predictive Monitoring (e.g., regular light transmission/flow rate checks). |
| Initial Break-In (D) | High initial failure rate that stabilizes. | ~7% [36] [37] | Complex robotic sample handler in an automated phenotyping system. | Intensive monitoring and adjustment during initial operation. |
| Random (E) | Consistent level of random failure over the equipment's life. | ~11% [37] to ~14% [36] | Control board failure due to power surge; software lock-up. | Ensure spare parts availability; use fault-detection controls. |
| Infant Mortality (F) | High initial failure rate followed by a random level. | ~68% [37] | Faulty wiring in a new LED array; defective valve in an irrigation system. | Burn-in testing; supplier quality verification. |
Table 2: FMEA Severity Rating Scale for Research Context
| Rating | Effect on Research | Severity of Effect |
|---|---|---|
| 10 | Catastrophic | Complete crop/experimental model loss; irreplaceable data loss; safety hazard. |
| 9 | Extreme | Major deviation in experimental conditions, invalidating a full study block. |
| 7-8 | High | Significant data corruption or loss for a key dependent variable. |
| 5-6 | Moderate | Noticeable effect on plant growth, requiring data annotation but not study halt. |
| 3-4 | Low | Minor inconvenience with no measurable impact on experimental outcomes. |
| 1-2 | None | No discernible effect. |
The Scientist's Toolkit
Table 3: Essential Research Reagent Solutions for Predictive Maintenance
| Item | Function in Predictive Maintenance Context |
|---|---|
| Data Loggers | Independent, calibrated sensors to verify the performance of built-in equipment sensors and collect baseline operational data. |
| Vibration Analysis Tools | To monitor motors and pumps in HVAC, chillers, and irrigation systems for early signs of imbalance or bearing wear [36]. |
| Thermal Imaging Camera | To identify electrical hot spots in connections, panels, and motors, as well as insulation failures in growth rooms. |
| Water Quality Test Kit | Measures pH, conductivity, and dissolved solids to predict scaling and corrosion in hydroponic and cooling systems [36]. |
| Calibrated Light Meter | Quantifies Photosynthetically Active Radiation (PAR) to track the degradation of LED and UV light sources over time. |
Workflow and System Diagrams
FMEA to Predictive Maintenance Workflow
Critical Research Assets System Map
Sensor Selection Guide for Predictive Maintenance
Selecting the appropriate sensors is the first critical step in building a reliable predictive maintenance system for plant growth equipment. The table below summarizes the key IoT sensors and their roles in monitoring essential parameters.
Table: Key IoT Sensors for Predictive Maintenance in Research Environments
| Sensor Type | Measured Parameter | Role in Predictive Maintenance | Common Research Equipment Applications |
|---|---|---|---|
| Vibration/Accelerometer [38] [39] | Vibration frequency and amplitude | Detects imbalances, misalignments, or bearing failures in rotating components. [39] | Growth chamber fans, environmental control motors, automated liquid handling systems, shakers. [11] |
| Thermal Sensors [38] | Temperature | Identifies abnormal temperature fluctuations indicating motor stress, cooling failure, or friction. [38] | Incubators, bioreactors, climate-controlled growth rooms, HVAC systems. [38] [11] |
| Humidity Sensors [38] | Relative Humidity / Water Vapor | Ensures environmental consistency and detects failures in humidification or dehumidification systems. [38] | Plant growth chambers, tissue culture rooms, sterile processing areas. [38] |
| Pressure Sensors [38] | Pressure of liquids or gases | Monitors for clogs, leaks, or pump failures in fluidic systems. [38] | Irrigation systems, nutrient delivery systems, pneumatic controls, filtration systems. [38] |
| Quality Sensors [38] | Presence of specific gases or chemicals | Detects leaks of CO₂ or other gases used in environmental enrichment or process control. [38] | Sealed growth chambers with CO₂ enrichment, anaerobic chambers, safety cabinets. [38] |
Deployment Methodology: A Step-by-Step Experimental Protocol
Deploying sensors for a predictive maintenance experiment requires a structured approach to ensure data quality and system reliability.
Phase 1: Pre-Deployment Planning
- Define Critical Equipment: Identify high-value or mission-critical assets whose failure would disrupt research, such as specialized incubators or automated analyzers. [11]
- Hypothesize Failure Modes: Formulate testable hypotheses on potential equipment failures (e.g., "A failing fan bearing will manifest as a 20% increase in high-frequency vibration").
- Select Sensor Locations: Choose mounting locations that accurately reflect the component's condition. For vibration, this is typically as close as possible to the bearing housing on a rotating motor. [39]
Phase 2: Installation and Configuration
- Physical Installation: Securely mount sensors. Vibration sensors often use magnetic or adhesive mounts for stability, while temperature and humidity sensors should be placed in a representative airflow. [39]
- Power and Connectivity: Establish a connection to the IoT network. For long-term experiments, select sensors with long-life batteries (up to 7 years) to minimize maintenance interruptions. [39]
- Baseline Data Collection: Operate the equipment under normal conditions for a defined period to establish a baseline for key parameters like normal vibration spectra and operating temperature ranges. [11] [28]
Phase 3: Integration and Analysis
- Data Integration: Use an IoT platform to collect, normalize, and store data from all sensors. [38] [40] The platform should harmonize timestamps from different sensors for coherent analysis. [28]
- Set Alert Thresholds: Configure alerts based on deviations from the established baseline. Start with conservative thresholds and refine them as more data is collected to minimize false positives. [28]
The workflow for this deployment protocol is summarized in the following diagram:
Troubleshooting Common Sensor Issues
When sensor data is anomalous or missing, follow this logical troubleshooting guide to diagnose the problem.
Frequently Asked Questions (FAQs)
Q1: Our vibration sensor on a growth chamber fan is reporting erratic data. What are the first things to check?
- A: First, verify the sensor is securely mounted; loose attachments cause unreliable readings. [41] Second, check for electromagnetic interference (EMI) from nearby motors or power cables. Try relocating the sensor or using shielded cables. [41] Finally, use the IoT platform to check the sensor's battery level if it's wireless. [39]
Q2: A temperature sensor in an incubator appears to have a constant offset compared to a calibrated thermometer. How can I fix this?
- A: This indicates a need for calibration. You can recalibrate the sensor using known reference points (e.g., 0°C in an ice bath and 100°C in boiling water) if supported by the sensor's software. [41] Ensure the sensor probe is clean and properly ventilated, as debris can insulate it and cause inaccurate readings. [41]
Q3: Several of our wireless sensors are experiencing intermittent data transmission failures. What could be the cause?
- A: This is often a network connectivity issue.
- Signal Strength: Check if the signal strength between the sensor and the gateway is weak. Consider adding signal boosters. [41]
- Network Congestion: For WiFi-based sensors, switch to a less congested frequency band. [41]
- Gateway Status: Verify that the IoT gateway is online and functioning correctly. [41]
- Firmware: Check with the manufacturer for firmware updates that may resolve connectivity bugs. [41]
Q4: What is the difference between preventive and predictive maintenance in our research context?
- A: Preventive Maintenance (PM) is performed on a set schedule (e.g., cleaning a fan filter every 3 months), regardless of its actual condition. [12] Predictive Maintenance (PdM) uses data from IoT sensors to monitor the equipment's actual condition in real-time, allowing you to perform maintenance only when a need is detected (e.g., when vibration levels exceed a baseline), thus preventing unnecessary maintenance and unexpected failures. [12] [40] [11]
Table: Key Research Reagent Solutions for Sensor Deployment
| Item / Solution | Function in Experiment |
|---|---|
| IoT Application Enablement Platform [40] | A cloud platform that provides developers with tools to quickly build a working application and user interface for visualizing sensor data and generating alerts with very little code. [40] |
| Pre-trained Predictive Models [28] | Ready-to-use models for specific assets or failure modes (e.g., for fans or pumps) that help researchers start with predictive analytics without first building a custom model from scratch. [28] |
| Data Collection & Harmonization Tools [28] | Software applications that synchronize data collection from multiple sensors and harmonize all timestamps into a single database, which is essential for accurate time-series analysis. [28] |
| Shielded Cables [41] | Cables designed to protect data signals from Electromagnetic Interference (EMI), which is a common cause of distorted readings from sensors in electrically noisy lab environments. [41] |
| Reference Thermometer / Hygrometer | A calibrated, high-precision instrument used to provide known reference points for validating and recalibrating deployed temperature and humidity sensors. [41] |
Data Acquisition & Preprocessing Troubleshooting Guide
Common Issue: Noisy Sensor Data Obscures True Equipment Signals
Problem: Vibration or environmental data from plant growth chambers is dominated by noise, making it impossible to detect early signs of component failure like bearing wear in HVAC systems or pump irregularities in irrigation units.
Solution: Apply signal denoising techniques to isolate the true equipment signature.
- Methodology: Implement a digital low-pass filter to remove high-frequency noise. The Butterworth filter is often preferred for its maximal flat magnitude in the passband [43].
- Experimental Protocol:
- Determine Sampling Rate: Ensure your data acquisition system samples the signal at a rate significantly higher (at least twice, per the Nyquist rate) than the highest frequency component of the true signal you wish to preserve [43].
- Select Cutoff Frequency: Choose a cutoff frequency that is above the maximum frequency produced by your equipment's normal operation but below the noise frequency range.
- Apply Filter: Use the following code example in Python to design and apply the filter.
Common Issue: Inconsistent or Missing Data from Multiple Sensor Types
Problem: Data aggregated from heterogeneous sources (e.g., temperature sensors, CO₂ monitors, vibration loggers) contains missing values, duplicates, or incompatible units, corrupting the predictive model [44] [45].
Solution: Execute a structured data cleansing and aggregation protocol.
- Methodology: Follow a sequential process of cleaning, integration, and transformation [44].
- Experimental Protocol:
- Handle Missing Values: For each sensor stream, identify missing data points. Use imputation (replacing with mean/median) or deletion, depending on the extent and nature of the missing data [44] [46].
- Remove Duplicates & Outliers: Identify and remove duplicate entries. Detect outliers using statistical methods like the Z-score or IQR (Interquartile Range) and investigate their cause before potentially removing them [44] [46].
- Standardize Units & Formats: Ensure all temporal data uses the same timestamp format and all measurements use consistent units (e.g., Celsius for temperature) [45].
- Aggregate Data: Convert high-frequency data (e.g., readings per second) into meaningful intervals (e.g., hourly averages or maximum values) to reduce dataset size and complexity for modeling [45].
Common Issue: Predictive Models Fail to Generalize
Problem: A model trained on data from one type of growth chamber performs poorly when applied to another, due to differing data distributions or irrelevant features.
Solution: Perform feature scaling and selection during data preprocessing.
- Methodology: Normalize numerical features and select only the most relevant ones for model training [46].
- Experimental Protocol:
- Data Scaling: Use standardization (scaling data to have a mean of 0 and a standard deviation of 1) or Min-Max normalization (scaling data to a fixed range, often [0, 1]) to prevent features with large scales from dominating the model [46].
- Feature Selection: Analyze the correlation of all sensor readings with the target variable (e.g., equipment failure). Remove features with low correlation or high redundancy to reduce overfitting and improve model accuracy [46].
Frequently Asked Questions (FAQs)
What is the most critical step in data preparation for predictive maintenance?
Data cleaning is widely considered the most critical step. Predictive maintenance models are highly sensitive to data quality; without accurate, consistent, and reliable input data, even the most sophisticated algorithms will produce misleading results and false alarms. Data cleaning can consume up to 80% of the total project time [45].
How much historical data is needed to start building a predictive model?
It is recommended to gather at least two years of historical maintenance and operational data. This duration typically provides a sufficient number of failure and maintenance cycles to establish baseline performance patterns and identify early signs of degradation for critical assets [45].
What are the best practices for ensuring data security in a predictive maintenance system?
Implement a multi-layered security approach:
- Encryption: Use encrypted protocols for data transmission and storage [45].
- Access Control: Enforce multi-factor authentication (MFA) and role-based access controls to limit system access [45].
- Audits: Conduct regular security audits and updates to protect sensitive operational data [45].
Quantitative Data Specifications
Table 1: Sensor Data Acquisition Parameters
| Sensor Type | Key Measured Parameters | Common Data Issues | Recommended Sampling Rate | Key Metrics for Model |
|---|---|---|---|---|
| Vibration | Frequency, Amplitude | Noise, Missing Timestamps | High (≥ 100 Hz) | Harmonic peaks, Overall RMS level [43] |
| Temperature | °C / °F | Sensor Drift, Unit Inconsistency | Low (1/60 Hz) | Rate of change, Stable-state deviation [45] |
| Pressure | PSI / Bar | Spikes from blockages | Medium (1-10 Hz) | Mean pressure, Pressure drop over time [45] |
| Acoustic | dB, Frequency | Ambient Noise | High (≥ 2 kHz) | Sound intensity patterns, Anomalous frequencies [22] |
Table 2: Data Cleansing & Preprocessing Techniques
| Preprocessing Step | Standard Techniques | Tools / Algorithms | Purpose / Outcome |
|---|---|---|---|
| Handling Missing Data | Imputation (Mean/Median), Deletion | Pandas fillna(), dropna() [46] |
Ensures dataset completeness and accuracy [44] |
| Noise Reduction | Binning, Regression, Low-pass Filtering | Butterworth, Chebyshev filters [43] | Removes high-frequency noise to reveal true signal [44] |
| Data Transformation | Normalization, Standardization | Scikit-learn StandardScaler, MinMaxScaler [46] |
Brings features to a common scale for model stability [44] |
| Data Reduction | Feature Selection, Dimensionality Reduction | Principal Component Analysis (PCA) [44] | Reduces model complexity and training time [46] |
Experimental Workflow for Data Readiness
The following diagram illustrates the end-to-end pipeline for preparing data for predictive maintenance model training.
The Scientist's Toolkit: Research Reagent Solutions
Table 3: Essential Data Collection & Analysis Tools
| Item | Function / Application | Example Use Case in Research |
|---|---|---|
| IoT Vibration Sensors | In-situ monitoring of rotational equipment (e.g., fans, pumps) for early fault detection [45]. | Detecting imbalance in a growth chamber's circulation fan before it fails and alters the microclimate. |
| Acoustic Emission Sensors | Capturing high-frequency stress waves from material defects [22]. | Identifying micro-cracks in a pressurized nutrient delivery system. |
| Thermographic Camera | Non-contact temperature mapping of electrical components [22]. | Finding overheating connections in high-intensity lighting control systems. |
| Data Acquisition (DAQ) System | Hardware that interfaces with sensors to convert physical signals into digital data [45]. | Simultaneously logging temperature, humidity, and CO₂ levels from multiple sensors in a growth room. |
| Python (Pandas, Scikit-learn) | Primary programming environment for data cleansing, analysis, and machine learning [46]. | Building a script to automatically clean daily sensor data and calculate key health indicators. |
| Digital Signal Processing (DSP) Library (e.g., SciPy) | Provides algorithms for filtering, spectral analysis, and other signal operations [43]. | Applying a Butterworth filter to remove electrical noise from a motor's current signature. |
Model Comparison at a Glance
The table below summarizes the key characteristics of the three primary models discussed, helping you make an initial selection based on your project's data availability and goals.
| Model | Core Strengths | Data Requirements | Ideal for Predictive Maintenance... | Key Considerations |
|---|---|---|---|---|
| SVR (Support Vector Regression) | Effective in high-dimensional spaces; robust with small datasets. | Low to Moderate | ...when you have limited data for well-known, non-sequential failure modes. | Struggles with very large datasets and long-term temporal dependencies. |
| GPR (Gaussian Process Regression) | Provides uncertainty estimates with predictions; good for probabilistic analysis. | Low to Moderate | ...when quantifying prediction confidence is critical for risk assessment. | Computationally expensive for very large datasets. |
| LSTM (Long Short-Term Memory) | Excels at learning long-term temporal dependencies and sequential patterns. | High (Sequential/Temporal) | ...for forecasting Remaining Useful Life (RUL) or complex time-series anomaly detection [47] [28]. | Requires substantial, high-quality sequential data; more complex to train and debug [48]. |
Detailed Experimental Protocols
Protocol 1: Implementing an LSTM for RUL Prediction
This protocol outlines the steps for developing an LSTM model to predict the remaining useful life of critical equipment, such as a growth chamber's compressor or pump [49].
1. Objective: To train a model that accurately forecasts the Remaining Useful Life (RUL) of a component based on historical sensor data (e.g., vibration, temperature, current draw).
2. Data Preparation & Feature Engineering:
- Data Collection: Gather multivariate time-series data from all relevant sensors until component failure.
- Labeling: Calculate the RUL for each time step, often defined as the number of remaining operational cycles until a predefined failure threshold is reached [28].
- Windowing: Structure the data using a sliding window method. For example, use 100 time steps of historical sensor readings (features) to predict the RUL (target) at the next time step [50].
3. Model Architecture & Training:
- Architecture: A multi-layer LSTM network is typically used.
- Training: Use the Adam optimizer and a loss function like Mean Squared Error (MSE). The dataset should be split into training, validation, and test sets, ensuring that sequences from the same operational run are kept together [49].
4. Performance Evaluation:
- Primary Metric: Root Mean Square Error (RMSE) between the predicted and actual RUL.
- Secondary Metrics: Mean Absolute Error (MAE) and coefficient of determination (R²) to assess model fit [49].
Protocol 2: Building an Anomaly Detection Model with GPR
This protocol describes using GPR to identify unusual patterns in equipment behavior, which can signal the onset of failure.
1. Objective: To create a model that flags anomalous sensor readings deviating from "normal" operational behavior.
2. Data Preparation:
- Use only data from normal, healthy operation of the equipment to train the model.
- Preprocess the data by normalizing the sensor values.
3. Model Training & Prediction:
- Train a GPR model on the normalized "normal" data. GPR will learn the underlying distribution and covariance of the healthy system state.
- For new data, the model predicts a value and a confidence interval (uncertainty). A data point is flagged as an anomaly if the actual sensor value falls outside a certain confidence bound (e.g., 95% or 99%) of the predicted distribution.
4. Performance Evaluation:
- Metrics: Precision, Recall, and F1-score on a test set containing both normal and anomalous data.
Workflow and Model Architecture
The following diagram illustrates the end-to-end workflow for developing a predictive maintenance model, from data preparation to deployment.
Predictive Maintenance Modeling Workflow
This diagram details the internal "gating" structure of a single LSTM cell, which allows it to selectively remember or forget information over long sequences.
LSTM Cell Internal Architecture
Frequently Asked Questions (FAQs)
Q1: My LSTM model's loss is not decreasing and the predictions are poor. What could be wrong? A1: This is a common convergence issue. Follow this diagnostic checklist:
- Check your gradients: Use gradient monitoring in TensorFlow to see if they are vanishing (approaching zero) or exploding (becoming very large). Apply gradient clipping to counter explosions [48].
- Inspect learning rate: A learning rate that is too high can cause divergence, while one that is too low leads to a plateau. Use a learning rate scheduler (e.g., cosine decay) for better performance [51] [48].
- Verify data preprocessing: Ensure your input data is correctly normalized. The model may struggle with unnormalized, large-value features [48].
Q2: The model works well on training data but performs poorly on new, unseen validation data. How can I fix this overfitting? A2: Overfitting indicates your model has memorized the training data instead of learning to generalize.
- Increase regularization: Implement dropout within your LSTM layers (
dropoutandrecurrent_dropoutparameters in Keras) to randomly ignore units during training [51] [48]. - Simplify the model: Reduce the number of LSTM layers or units per layer. A model that is too complex for the dataset will overfit more easily.
- Use early stopping: Halt training automatically when the validation loss stops improving for a specified number of epochs [48].
- Gather more data: If possible, augment your training dataset with more examples of normal and faulty operation.
Q3: I don't have extensive historical failure data. Can I still implement predictive maintenance? A3: Yes. A highly effective approach in this scenario is Anomaly Detection. Instead of predicting a specific failure or RUL, you train a model (like a GPR or an autoencoder) solely on data from "normal" equipment operation. This model can then flag significant deviations from this baseline as potential early warnings of issues, all without needing explicit failure examples [28].
Q4: How can I better understand what my LSTM model is doing? A4: Leverage visualization and debugging tools.
- Activation Inspection: Create a secondary model to output the internal gate activations (forget, input, output) and check if they are saturating (stuck at 0 or 1), which can hinder learning [48].
- Use TensorBoard: Visualize loss curves, weight histograms, and computational graphs to get insights into the training process and model behavior [48].
The Scientist's Toolkit: Key Research Reagents & Solutions
This table lists essential computational tools and concepts used in developing predictive maintenance models.
| Item / Technique | Function / Explanation |
|---|---|
| TensorFlow / Keras | A core open-source library for building and training deep learning models, including LSTMs. Provides high-level APIs for rapid prototyping [51]. |
| CTC (Connectionist Temporal Classification) Loss | A specialized loss function used for sequence prediction problems where the alignment between input and output is unknown. Highly useful for processing sequential sensor data without clear event boundaries [52]. |
| Adam (Adaptive Moment Estimation) Optimizer | An efficient stochastic optimization algorithm that is commonly the default choice for training deep learning models like LSTMs due to its adaptive learning rate [49] [51]. |
| Root Mean Square Error (RMSE) | A standard metric for evaluating regression model performance, such as RUL prediction. It measures the square root of the average squared differences between prediction and actual observation [49]. |
| Gradient Clipping | A technique to prevent the "exploding gradients" problem in RNNs/LSTMs by capping the gradient values during backpropagation, thus stabilizing training [48]. |
### Frequently Asked Questions (FAQs)
Q1: What is the primary purpose of establishing alarm limits in a predictive maintenance system for plant growth equipment?
The primary purpose is to provide clear, timely alerts about abnormal conditions or equipment malfunctions, allowing researchers to take immediate and appropriate actions [53]. Properly set alarm limits enable the early detection of system anomalies, prevent critical failures in sensitive plant growth environments, reduce false alarms that can overwhelm staff, and maintain strict situational awareness for research integrity [53] [54]. This is crucial for ensuring experimental consistency and protecting valuable biological samples.
Q2: How do I determine the correct alarm limits for parameters like temperature, humidity, or CO2 in a growth chamber?
Determining correct alarm limits involves a multi-step process:
- Analyze Historical Data: Review historical equipment performance data and process requirements to understand normal operating ranges and natural variations for your specific research setup [55] [56].
- Conduct Alarm Rationalization: Collaborate with subject matter experts and stakeholders to critically define alarm setpoints, time delays, and other system-specific configurations based on the criticality of each parameter to your research outcomes [53].
- Document in an Alarm Philosophy: Formalize the findings and rationale in an alarm philosophy document, which outlines the objectives, strategies, and responsibilities related to alarm management for your facility [53].
Q3: Our research team is overwhelmed by alarm floods. What is the best strategy to prioritize alarms effectively?
The best strategy is to implement alarm prioritization and grouping [53]. Categorize alarms based on their potential impact on research and equipment. Adopting a standard methodology, such as the ISA 18.2 standard, ensures consistent practices. A typical prioritization scheme includes:
- Critical: Requires immediate action (e.g., total climate control failure).
- High: Requires prompt intervention (e.g., parameter drift beyond safe threshold).
- Medium: Requires action in a defined timeframe (e.g., filter clog warning).
- Low: For information only, does not require immediate action (e.g., routine maintenance reminder).
Grouping related alarms helps reduce cognitive load, allowing operators to address multiple related issues efficiently [53].
Q4: What are the key benefits of integrating alarm systems with an Asset Management system?
Integration creates a seamless workflow that enhances research reliability. Key benefits include:
- Enhanced Safety: Promptly alerts personnel to abnormal conditions, preventing accidents that could damage experiments [53].
- Improved System Reliability: Identifies potential issues before they escalate into major problems, ensuring uninterrupted operation of growth chambers and bioreactors [53].
- Operational Efficiency: Streamlines the workflow from alarm detection to maintenance resolution, minimizing downtime and improving operator response time [53] [54].
- Informed Decision-Making: Provides a unified view of asset health and alarm history, enabling data-driven decisions about maintenance and resource allocation [57] [58].
Q5: Which technologies are most suitable for monitoring critical plant growth assets?
The choice of technology should be driven by the asset's failure modes [59] [55]. The following table summarizes common options:
Table: Key Predictive Maintenance Technologies for Research Equipment
| Technology | Primary Function | Ideal Application in Plant Research | Key Advantage |
|---|---|---|---|
| Vibration Analysis [55] | Detects mechanical degradation via vibration monitoring. | Rotating equipment (e.g., fans, pumps in HVAC systems). | Provides the earliest indication of mechanical failures like bearing wear [59]. |
| Infrared Thermography [55] | Detects temperature anomalies and "hotspots" without contact. | Electrical panels, motor bearings, steam traps. | Identifies overheating components before they fail. |
| Ultrasonic Acoustic Monitoring [55] | Detects high-frequency sounds from friction and stress. | Slow-rotating bearings, valve leaks, electrical arcing. | Can identify issues inaudible to the human ear. |
| Temperature Monitoring [59] | Monitors for deviations from set temperature ranges. | Growth chambers, incubators, bioreactors. | Critical for maintaining precise environmental conditions. |
### Troubleshooting Guides
Issue 1: Excessive Number of Alarms (Alarm Flood)
Symptoms: Operators receive more alarms than they can effectively manage; critical alarms are missed amidst non-critical ones.
Resolution Steps:
- Rationalize Alarms: Conduct a formal alarm rationalization study to justify and document every alarm. Remove unnecessary alarms and ensure the remaining ones have well-defined setpoints and priorities [53].
- Implement Filtering: Use alarm system features to suppress related or consequential alarms that stem from a single root cause, reducing the total number presented to the operator [54].
- Apply Deadbands: Configure deadbands (a range around the setpoint where no alarm is triggered) for analog parameters to prevent alarms from repeatedly triggering due to minor, normal fluctuations [53].
- Review and Update: Periodically review alarm system performance metrics and update the alarm philosophy to reflect changes in equipment or research protocols [53].
Issue 2: Alerts Not Triggering Maintenance Workflows
Symptoms: Alarms are detected but do not automatically generate work orders in the Computerized Maintenance Management System (CMMS), leading to delayed or missed maintenance.
Resolution Steps:
- Verify Integration Architecture: Check the data integration between the monitoring platform (e.g., SCADA, IIoT platform) and the CMMS. Ensure APIs or middleware are correctly configured and operational [59] [60].
- Check Alert Rules: Confirm that the rules within the analytics platform are correctly configured to trigger an alert when a parameter exceeds its defined limit [55].
- Validate Data Flow: Ensure sensor data is being received and processed by the analytics platform. Diagnose any communication failures with IoT sensors or data loggers [56].
- Test the Workflow: Perform an end-to-end test with a simulated fault to validate that an alarm in the monitoring system creates a corresponding work order in the CMMS [60].
Issue 3: Inaccurate or False Positive Alarms
Symptoms: Alarms are triggered even though the equipment is operating normally, leading to mistrust of the system.
Resolution Steps:
- Calibrate Sensors: Regularly calibrate all sensors (e.g., temperature, humidity, pressure) according to the manufacturer's schedule to ensure data accuracy [56].
- Adjust Setpoints and Delays: Review and adjust alarm setpoints and time delays. A time delay can prevent brief, insignificant spikes from triggering a full alarm [53].
- Review Analytics Model: If using machine learning, check the model's baseline. A model trained on insufficient or non-representative data may produce false positives. Retrain the model with higher-quality data [22].
- Inspect Physical Components: Physically inspect the sensor and its environment for damage, contamination, or improper installation that could lead to erroneous readings [56].
### Experimental Protocol: Establishing Alarm Limits for a Growth Chamber
Objective: To systematically define and validate high and low alarm limits for the temperature parameter of a plant growth chamber, ensuring both operational safety and research integrity.
Materials & Equipment:
- Plant growth chamber with programmable controls
- Calibrated, independent temperature data logger
- Asset Management or CMMS software (e.g., PRM, Maximo, or equivalent) [57] [54]
- Alarm management software or SCADA system
Methodology:
- Baseline Data Collection:
- Set the growth chamber to its standard operating temperature (e.g., 22°C).
- Use an independently calibrated data logger to record the chamber's temperature every minute for a minimum of 72 hours during an active experiment to capture normal operational variance.
- Data Analysis:
- Analyze the collected data to determine the mean temperature and the natural standard deviation.
- Calculate preliminary alarm limits. A common starting point is to set the high alarm at the mean + 3 standard deviations and the low alarm at the mean - 3 standard deviations. This captures 99.7% of normal variation.
- Alarm Rationalization:
- Convene a meeting with lead researchers and facility managers.
- Present the data-driven preliminary limits.
- Based on experimental criticality (e.g., "a deviation of more than 1.5°C will compromise plant physiology"), collaboratively finalize the alarm limits. Document the rationale for these limits.
- System Configuration & Integration:
- Program the final high and low alarm limits into the growth chamber's controller and/or the central monitoring software.
- In the Asset Management system (e.g., PRM), configure the system to generate a "maintenance alarm" of appropriate priority when this temperature alarm is triggered [54].
- Integrate this maintenance alarm with the CMMS to automatically generate a work order for the facilities team.
- Validation Test:
- Deliberately induce a minor temperature deviation that should trigger the alarm (ensure this will not harm any biological samples).
- Verify that:
- The alarm is correctly triggered in the monitoring system.
- A maintenance alarm appears in the Asset Management system.
- A corresponding work order is created in the CMMS.
- The correct personnel are notified via email or dashboard alert [54].
### Research Reagent Solutions & Essential Materials
Table: Essential Tools for a Predictive Maintenance Research Program
| Item / Solution | Function in Predictive Maintenance Setup |
|---|---|
| IoT Vibration Sensors [55] [60] | Permanently mounted on rotating assets (pumps, fans) to detect imbalance or bearing wear that could lead to climate control failure. |
| Wireless Temperature/Humidity Loggers | Provide continuous, real-time monitoring of environmental parameters within growth chambers and rooms, feeding data to the central platform. |
| Infrared Thermal Camera [55] | Used for periodic manual inspections to identify electrical hot spots in panels or overheated motor bearings without physical contact. |
| Ultrasonic Inspection Tool [55] | Detects leaks in pressurized air and water lines, and abnormal friction in bearings, often before these issues are detectable by other means. |
| Asset Management Platform (e.g., PRM, Maximo) [57] [54] | The central software that manages device status, receives diagnostic results, and distributes maintenance alarms to both operators and maintenance personnel. |
| CMMS Software [59] [60] | The system that receives alerts from the Asset Management platform and automates the creation, assignment, and tracking of maintenance work orders. |
### Alarm Integration and Response Workflow
The following diagram illustrates the integrated logical workflow from fault detection to resolution, showing how alarm systems and asset management interact.
Optimizing Performance and Overcoming Implementation Challenges
Troubleshooting Guides
Guide 1: Addressing Poor Data Quality
Problem: Your predictive models are unreliable, and alerts do not correspond to actual equipment issues. This is often caused by underlying data quality problems.
Diagnosis and Solution: Follow this systematic approach to identify and rectify common data quality issues.
Check Data Completeness:
- Symptom: Models fail to train or produce erratic predictions.
- Solution: Audit your data pipelines for gaps. Ensure sensors are streaming data continuously and that historical data logs are complete. Implement data validation rules to flag missing data points automatically [33].
Verify Data Accuracy:
- Symptom: Sensor readings seem physically impossible or do not match physical reality.
- Solution: Regularly calibrate all sensors (e.g., temperature, vibration, pressure) according to manufacturer specifications. Check for sensor drift by comparing readings to known good values [33].
Assess Data Relevance:
- Symptom: The data collected doesn't seem to correlate with the failure modes you are trying to predict.
- Solution: Revisit your hypothesis. Collaborate with domain experts to ensure you are measuring the correct parameters (e.g., vibration for bearing wear, thermal profiles for electrical components) that are causal to the target failure [61].
Clean and Preprocess Data:
Guide 2: Managing a High Rate of False Positives
Problem: Your system generates numerous alerts, but most are false alarms. This leads to "alert fatigue," where technicians start to ignore critical notifications [63].
Diagnosis and Solution:
Refine Model Thresholds:
- Symptom: The system is overly sensitive, flagging minor deviations from the norm.
- Solution: Adjust the anomaly detection thresholds. Instead of using static limits, employ dynamic thresholds that account for normal operational states (e.g., different thresholds for startup vs. steady-state operation) [63].
Improve Model Training with Balanced Data:
- Symptom: The model is bad at recognizing rare failure events because it was trained mostly on "normal" data.
- Solution: Address class imbalance using techniques like:
Incorporate Human-in-the-Loop Validation:
- Action: Do not rely solely on automated alerts. Have a condition monitoring expert or a skilled technician review and validate alerts before they trigger a full maintenance work order. This human feedback can also be used to re-train and improve the model [64].
Invest in Advanced AI:
Guide 3: Improving Low Model Accuracy
Problem: Your model's predictions are consistently wrong, failing to forecast failures with enough lead time or accuracy to be useful.
Diagnosis and Solution:
Evaluate and Select the Right Algorithm:
- Action: Not all algorithms are equal. For complex time-series data, deep learning models like Long Short-Term Memory (LSTM) networks have demonstrated superior accuracy in predicting failures compared to traditional machine learning models [65]. Start with simpler models for baseline performance and progress to more complex ones like LSTMs or XGBoost as needed [65].
Ensure Adequate and Representative Training Data:
- Symptom: The model performs well on training data but poorly on new, real-world data.
- Solution: The model needs a large amount of clean historical data that includes examples of both normal operation and failure events [61]. If failure data is scarce, use techniques like Failure Mode Effects Analysis (FMEA) to simulate failure data for training [66].
Implement a Robust Model Evaluation Framework:
- Action: Move beyond simple accuracy metrics. Use a suite of evaluation tools to get a true picture of performance [33]:
- Confusion Matrix: To visualize true positives, false positives, true negatives, and false negatives.
- Precision and Recall: Precision reduces false positives; recall ensures you catch most failures.
- ROC Curve and AUC: Assesses the model's overall diagnostic ability.
- Action: Move beyond simple accuracy metrics. Use a suite of evaluation tools to get a true picture of performance [33]:
Establish a Continuous Feedback Loop:
Frequently Asked Questions (FAQs)
Q1: We are just starting out and have very little historical failure data. Can we still implement predictive maintenance? A: Yes. Begin with unsupervised machine learning approaches such as anomaly detection and clustering. These methods do not require labeled failure data. They learn the "normal" operating baseline of your equipment and flag significant deviations as anomalies, which can indicate impending failure [61]. You can also use simulation tools or FMEA to generate initial failure data for training [66].
Q2: What is the single most important factor for a successful PdM program? A: While technology is critical, success often hinges on people and processes. A common reason for failure is the "inability to work with the system," where teams don't trust or understand the AI's recommendations [66]. Securing buy-in from stakeholders, providing thorough training, and fostering a data-driven culture are as important as the algorithms themselves [64] [66].
Q3: How can we quantify the return on investment (ROI) of our PdM program? A: Track key performance indicators (KPIs) before and after implementation. Effective metrics include [7] [62]:
- Reduction in unplanned downtime (aim for 35-50%)
- Reduction in overall maintenance costs (aim for 25-30%)
- Increase in equipment availability and Overall Equipment Effectiveness (OEE)
Q4: Our alerts are not integrated into our workflow, so they get ignored. How can we fix this? A: The output of a predictive model (e.g., a CSV file) is often not actionable. Integrate alerts directly into your existing Computerized Maintenance Management System (CMMS) as automated work orders [61] [66]. For critical alerts, use mobile notifications. Ensure the alert contains prescriptive information—not just what is wrong, but what to do about it [64].
The following tables summarize key performance metrics and cost-benefit data from industry studies on predictive maintenance.
Table 1: Operational Performance Improvements from PdM
| Performance Metric | Reported Improvement | Source |
|---|---|---|
| Reduction in Unplanned Downtime | 35% - 50% | [7] |
| Elimination of Unexpected Breakdowns | 70% - 75% | [22] |
| Reduction in Maintenance Costs | 25% - 30% | [7] |
| Increase in Detection Accuracy | Up to 40% (with AI) | [7] |
| Reduction in False Alarms | Up to 30% (with AI) | [7] |
Table 2: Financial Impact and Market Data
| Financial Metric | Value | Source |
|---|---|---|
| Global PdM Market (2024) | $10.93 Billion | [7] |
| Projected PdM Market (2032) | $70.73 Billion | [7] |
| Adopters Reporting Positive ROI | 95% | [7] |
| Cost of Unplanned Downtime (Hourly Median) | > $125,000 | [7] |
Experimental Protocols
Protocol 1: Building a Baseline Model with Limited Data
Objective: To create an initial predictive maintenance model when labeled historical failure data is scarce.
Methodology:
- Data Collection: Collect sensor data (vibration, temperature, etc.) from your equipment over a period of normal operation [61].
- Anomaly Detection: Apply unsupervised learning algorithms like clustering (e.g., K-means) or autoencoders. These algorithms will group similar operational states and identify data points that do not fit any group, flagging them as anomalies [61].
- Labeling: Investigate these anomalies to determine if they represent early failure states. This process allows you to manually label your data and build a dataset for more advanced, supervised learning later [61].
- Validation: The model's success is measured by its ability to detect genuine early-stage failures (True Positives) while minimizing false alerts (False Positives).
Protocol 2: A/B Testing for Alert Fatigue Reduction
Objective: To scientifically evaluate and reduce the false positive rate of PdM alerts.
Methodology:
- Baseline Measurement: For one month, record the total number of alerts generated by your current system and the number of those that were confirmed false positives. Calculate the baseline false positive rate.
- Intervention: Implement one or more improvements, such as:
- Controlled Test: Run the new system in parallel with the old system (or use a historical dataset) for the same duration.
- Evaluation: Compare the false positive rates between the old (control) and new (test) systems. A statistically significant reduction in the test group validates the improvement.
System Workflows and Pathways
PdM System Data Flow
Model Evaluation and Improvement Cycle
The Scientist's Toolkit: Essential Research Reagent Solutions
This table details key hardware and software components essential for building a robust predictive maintenance research and implementation platform.
Table 3: Essential PdM Research Components
| Component Category | Specific Examples / Solutions | Primary Function in PdM Research |
|---|---|---|
| Sensing & Data Acquisition | Vibration sensors, Temperature sensors, Acoustic emission sensors, IO-Link enabled sensors [7] [66] | Captures raw, high-fidelity physical and process parameters from equipment for analysis. |
| Data Processing & Analytics | Python (Pandas, Scikit-learn), TensorFlow/PyTorch, LSTM Networks, XGBoost [65] | Provides the algorithmic toolkit for data cleaning, model development, training, and evaluation. |
| Data Infrastructure & Storage | Time-Series Data Historians, Cloud Platforms (AWS, Azure), Edge Computing Devices [67] [7] | Stores and processes large volumes of temporal data efficiently; enables low-latency analysis at the source. |
| Model Operationalization | Computerized Maintenance Management System (CMMS), Docker, Kubernetes [64] [62] | Platforms for deploying models into production, integrating alerts into workflows, and managing maintenance actions. |
| Validation & Simulation | Failure Mode Effects Analysis (FMEA), Digital Twin technology [7] [66] | Allows for hypothesis testing, risk assessment, and generating synthetic failure data in a risk-free virtual environment. |
Strategies for Setting Effective Alarm Limits Using Statistical Process Control
In the specialized field of plant growth equipment research for drug development, maintaining precise environmental control is not merely beneficial—it is essential for experimental validity and reproducibility. Statistical Process Control (SPC) provides a data-driven methodology to monitor processes and detect variations that could compromise research integrity. Effective alarm limits within an SPC framework act as an early warning system, alerting scientists to subtle process deviations in parameters such as temperature, humidity, light intensity, and nutrient delivery before they lead to significant experimental loss or faulty data. This guide details the strategies for implementing these critical alarms within the context of a predictive maintenance strategy for research equipment.
Understanding SPC Alarm Rules
SPC alarms are triggered by specific patterns in process data that indicate a process is shifting from its stable, in-control state. These rules are designed to detect both sudden and gradual changes.
The table below summarizes the most commonly used SPC rules for triggering alarms [68].
| SPC Rule | Description | Pattern Indicating a Shift | Common Cause in Research Context |
|---|---|---|---|
| Outside Control Limits | A single data point falls outside the upper or lower control limit (typically ±3σ) [68]. | A sudden, major shift in the process [68]. | Equipment failure (e.g., heater, LED driver), incorrect reagent concentration, sensor failure. |
| 2 of 3 Points in Zone A | Two out of three consecutive points are in Zone A (between 2σ and 3σ from the mean) [68]. | A medium-sized shift is occurring [68]. | Gradual sensor drift, partial blockage in a nutrient line, slow calibration decay. |
| 4 of 5 Points in Zone B | Four out of five consecutive points are in Zone B or beyond (between 1σ and 3σ) [68]. | A small, consistent drift in the process [68]. | Wear and tear on a pump motor, slow clogging of a filter, aging of a light source. |
| 9 Points on One Side | Nine consecutive points fall on the same side of the centerline (process average) [68]. | A small but persistent shift in the process mean [68]. | Systematic error from a misconfigured setpoint, a biased sensor, or a consistent environmental influence. |
| 6-Point Trend | Six consecutive points are continuously increasing or decreasing [68]. | A steady process drift over time [68]. | Gradual fouling of a sensor, slow leak in a pressurized system, progressive depletion of a CO₂ tank. |
| 14-Point Oscillation | Fourteen consecutive points alternate up and down [68]. | Systematic over-control or cyclic variation [68]. | Over-adjustment of manual controls, interaction with a poorly tuned PID controller, cyclic environmental factor. |
| 15 Points in Zone C | Fifteen consecutive points fall within Zone C (within 1σ of the mean) [68]. | Overly consistent data; may suggest stratified sampling or data manipulation [68]. | Sensor stuck at a fixed value, control limits set too wide, malfunctioning data logger. |
Methodologies for Establishing Alarm Limits and Baselines
Establishing effective alarm limits is a systematic process that moves from data collection to continuous refinement. The following workflow outlines the key stages.
Workflow Title: SPC Alarm Limit Establishment Process
Phase 1: Foundational Steps
- Define Critical Parameters: Identify the key process variables (KPIs) for your plant growth chamber that directly impact research outcomes. Examples include 24-hour light-cycle temperature, nutrient solution pH, relative humidity, and photosynthetic photon flux density (PPFD).
- Collect Baseline Data: Under normal, stable, and optimized operating conditions, collect a statistically sufficient dataset. A minimum of 20-25 data points is often recommended to reliably estimate the process mean (μ) and standard deviation (σ) [69]. For a new growth chamber, this involves running the equipment with standard settings and monitoring it closely to establish a "golden batch" profile.
Phase 2: Implementation & Calculation
- Calculate Control Limits: Using the baseline data, calculate the initial statistical limits [69].
- Centerline (CL): The process average (μ).
- Upper Control Limit (UCL): μ + 3σ
- Lower Control Limit (LCL): μ - 3σ
- Zones: Divide the area between the CL and control limits into three equal bands (Zone C: ±1σ, Zone B: ±2σ, Zone A: ±3σ) for applying Western Electric rules [68].
- Select and Configure SPC Rules: Choose the most relevant rules from the table in Section 2. Begin with fundamental rules like "Outside Control Limits" and "9 Points on One Side" to avoid alarm flooding initially [68] [70].
Phase 3: Continuous Improvement
- Implement, Monitor, and Investigate: Activate the alarms. For every alarm trigger, log the event and investigate the root cause [68]. Document the who, what, when, and why, and use tools like Pareto analysis to identify common failure modes.
- Refine and Rationalize: Periodically review alarm performance. If certain rules generate frequent false alarms, adjust the rules or investigate for persistent, unaddressed special causes. The goal is to have a system that is responsive yet not overwhelming [71] [70].
Troubleshooting Guide: SPC Alarm Scenarios
FAQ: Frequently Asked Questions
Q: Why would I want an alarm if the data is still within the control limits? A: The purpose of SPC is to detect process shifts before they become large enough to produce defects or invalidate experiments. Rules like trends or multiple points near the limits catch early warning signs of drift, allowing for proactive intervention and predictive maintenance [68] [69].
Q: What is the first action I should take when an SPC rule is violated? A: The first step is always to log the event and then investigate the root cause [68]. Do not simply reset the system. Document the conditions, check the equipment, and review recent changes to the process. This investigation is a critical source of learning for improving system reliability.
Q: Our system is generating too many alarms, causing "alarm fatigue." What can we do? A: Alarm floods are a common issue with poorly managed digital systems [70]. Address this by:
- Rationalize Alarms: Scrutinize each alarm. Is it necessary? Does it directly relate to a critical parameter? Remove or downgrade non-essential alarms [70].
- Prioritize Alarms: Classify alarms by severity (e.g., High, Medium, Low) to ensure critical alerts get immediate attention [70].
- Use Grouping and Suppression: For a single failure that causes multiple related alarms (e.g., a chiller failure triggers low temp, high humidity, etc.), program the system to present a single, concise master alarm [70].
Q: How do I set alarm limits when there is no OEM recommendation? A: You can use a statistical approach based on your own baseline data. A recommended method is to perform a sampling study under normal conditions and use standard deviation. For example, a data point outside ±2 standard deviations from your process average could be considered a "marginal" alert, while a point beyond ±3 standard deviations would be "critical" [71]. The ASTM D7720 standard provides a formal reference for this methodology [71].
The Researcher's Toolkit: Essential Reagents & Materials
The following table lists key items and their functions for establishing and maintaining an SPC-based monitoring system for growth chambers.
| Item | Function in SPC & Predictive Maintenance |
|---|---|
| Calibrated Sensor Array | Provides the raw data for SPC charts. Regular calibration is essential to ensure data integrity and accurate alarm triggering. |
| Data Logging Software | Automatically collects and time-stamps sensor readings, creating the historical dataset needed for baseline establishment and control charting. |
| SPC or Statistical Software | Performs the calculations for control limits (mean, standard deviation) and automatically applies SPC rules to generate alarms. |
| Documentation System | A centralized log (e.g., an ELN or CMMS) for recording all alarm events, investigative findings, and corrective actions, creating an audit trail. |
| Reference Standards | Certified materials (e.g., pH buffer solutions, NIST-traceable thermometers) used to validate and calibrate sensors, ensuring measurement accuracy. |
Advanced Alarm Management: From Detection to Prediction
Effective alarm management extends beyond initial setup. As your system matures, focus on alarm rationalization—a periodic, formal review to ensure every alarm is necessary, has the right priority, and is properly configured [70]. Furthermore, the data collected through SPC provides the foundation for a predictive maintenance strategy. By analyzing trends in alarm frequency and the progression of parameter drift (e.g., a slowly increasing number of "2 of 3 Points in Zone A" alarms for a pump's power draw), researchers can forecast equipment end-of-life and schedule maintenance during planned downtime, preventing unplanned experimental disruption [68] [55]. This transforms the SPC system from a simple monitor into a powerful tool for guaranteeing research continuity and data quality.
Root Cause Analysis and Prescriptive Actions from Predictive Insights
Frequently Asked Questions (FAQs)
1. What is the difference between a predictive insight and a prescriptive action in the context of research equipment?
A predictive insight is a data-driven forecast of a potential future equipment failure or performance anomaly. It answers the question, "What is likely to happen?" For example, a model might predict a compressor failure in a climate control unit within the next 50 hours based on vibration analysis [72] [73].
A prescriptive action is a specific, recommended step generated to prevent the predicted issue or optimize performance. It answers the, "What should we do about it?" Based on the prediction, the system might prescribe, "Adjust the setpoint to 22°C and schedule a maintenance check for PN 789 within 24 hours" [73] [74].
2. How can AI enhance traditional Root Cause Analysis (RCA) for complex system failures?
Traditional RCA relies on manual data collection and analysis, which can be time-consuming and prone to human bias, especially with complex systems involving multiple variables [75]. AI-powered RCA can automatically process vast amounts of historical and real-time data from sensors, logs, and operational records [75]. It uses machine learning to detect subtle, non-obvious patterns and correlations that a human might miss, leading to faster and more accurate identification of the fundamental root cause [75].
3. Our research requires a pristine environment. How can these techniques help maintain compliance with stringent quality standards?
Predictive maintenance and RCA are crucial for compliance in environments with strict standards [76] [77]. By continuously monitoring equipment that controls critical parameters (e.g., HVAC in cleanrooms, sterilization equipment), predictive tools can identify deviations that might compromise environmental conditions before they exceed regulatory limits [76]. RCA ensures that if a deviation occurs, the underlying cause is eliminated, preventing recurrence and providing a documented, data-backed trail for audits [76] [75].
4. What are the common challenges in implementing a predictive maintenance system, and how can they be overcome?
| Challenge | Solution |
|---|---|
| Integration with Legacy Systems [76] [78] | Start with a gradual, pilot program on critical assets. Use adaptable software and middleware for connectivity [76]. |
| Data Overload & Management [76] [78] | Invest in a centralized data management platform (e.g., CMMS+) designed to handle, analyze, and derive insights from large data volumes [76]. |
| High Upfront Costs [76] | Conduct a thorough cost-benefit analysis focusing on ROI from preventing downtime, reducing emergency repairs, and extending equipment life [76] [77]. |
| Skill Gaps Among Technicians [76] [78] | Implement targeted training and upskilling programs on data interpretation and new technologies. Consider partnerships with technical schools [78]. |
| Resistance to Organizational Change [76] | Develop a clear change management strategy. Communicate benefits, involve staff in the process, and provide strong support during transition [76]. |
Troubleshooting Guides
Scenario 1: Unexplained Fluctuations in Growth Chamber Humidity
| Troubleshooting Step | Action & Quantitative Check |
|---|---|
| 1. Define the Problem | Document the issue: "Cyclic humidity fluctuations between 70-85% in Chamber B, despite a setpoint of 65%. Occurring daily during peak lighting hours for the past 72 hours." |
| 2. Collect Data | Gather 30 days of historical data: humidity logs, temperature, compressor & dehumidifier run cycles, condenser performance, and lighting schedules from the CMMS [79]. |
| 3. Perform Root Cause Analysis | Use a Fishbone Diagram to categorize potential causes [72] [79]. The AI analysis reveals a strong correlation between the chamber's internal temperature rising above 28°C and the dehumidifier's condenser becoming overloaded, reducing its efficiency [75]. |
| 4. Identify Root Cause & Implement Solution | Root Cause: Undersized dehumidifier unit for the heat load generated during the peak lighting period. Prescriptive Action: Schedule a temporary reduction in light intensity during the hottest part of the day as an immediate fix. For a long-term solution, requisition and install a dehumidifier with a 30% higher capacity. |
| 5. Monitor Results | Track humidity stability for 7 days post-solution. Confirm that humidity remains at 65% ±3% during peak lighting hours. |
Scenario 2: Repeated Failure of LED Array in Multi-spectral Imaging System
| Troubleshooting Step | Action & Quantitative Check |
|---|---|
| 1. Define the Problem | "LED Array C in the NIR spectrum fails every ~120 hours of operation. Failure mode is consistent thermal degradation." |
| 2. Collect Data | Gather work orders, replacement records, thermal imaging history, driver unit voltage/current logs, and ambient temperature data for the enclosure [75] [79]. |
| 3. Perform Root Cause Analysis | Use the 5 Whys technique [72] [79]: 1. Why did the LED fail? Overheating. 2. Why did it overheat? The heat sink was ineffective. 3. Why was the heat sink ineffective? Thermal paste application was uneven. 4. Why was the paste uneven? The manual application process is inconsistent. 5. Why is the process inconsistent? Lack of a standardized protocol and proper tooling. |
| 4. Identify Root Cause & Implement Solution | Root Cause: Inconsistent thermal management due to a non-standardized assembly process. Prescriptive Action: Create a standardized assembly jig and protocol specifying the exact amount and pattern of thermal paste application. Train all relevant personnel. |
| 5. Monitor Results | Track the Mean Time Between Failures (MTBF) for the LED arrays. The target is an increase from 120 hours to the manufacturer-specified 1,000 hours. |
Scenario 3: Gradual Drift in Nutrient Dosing Pump Accuracy
This problem can be subtle and lead to invalid experimental results.
The Scientist's Toolkit: Key Research Reagent Solutions
| Item | Function in Predictive Maintenance & RCA |
|---|---|
| Predictive Maintenance Software (e.g., Senseye PdM) | Uses advanced analytics and machine learning on real-time equipment data to forecast failures and estimate remaining useful life for critical assets [77]. |
| Computerized Maintenance Management System (CMMS+) | A centralized software platform for managing assets, work orders, spare parts inventory, and maintenance history. Essential for data collection and tracking RCA outcomes [76]. |
| IoT Vibration Sensors | Attached to motors, pumps, and fans to monitor for abnormal oscillations. Specific vibration patterns can predict issues like imbalance, misalignment, or bearing wear [72]. |
| Thermal Imaging Camera | Used for thermography analysis to detect unusual heat patterns in electrical connections, mechanical components, and insulation, identifying potential failure points before they escalate [77]. |
| Data Management & Analytics Platform (e.g., Tableau, Adobe Analytics) | Tools to visualize, analyze, and derive insights from the large, complex datasets generated by sensors and equipment, facilitating both diagnostic and predictive tasks [73] [80]. |
Addressing Data Security and Cultural Adoption Barriers
Troubleshooting Guide and FAQs
This technical support center provides targeted guidance for researchers, scientists, and drug development professionals implementing predictive maintenance systems for plant growth equipment. The FAQs below address common technical and organizational challenges.
Frequently Asked Questions
Our predictive maintenance system is generating alerts, but our research technicians are ignoring them. How can we improve adoption? This is a common cultural adoption barrier. Research indicates that 55-70% of implementations face workforce resistance, often due to fear of job displacement or skepticism about the new system's accuracy [3]. To address this:
- Implement Incentive Programs: Establish recognition programs and performance-based rewards to motivate staff participation and align their efforts with research objectives [81].
- Enhance Training: Provide hands-on training sessions that include interactive experiences and clear demonstrations of how the system prevents equipment failure, which can compromise long-term experiments [81].
- Promote Transparency: Use explainable AI systems that show the reasoning behind predictions to build organizational confidence in algorithm-based decisions [3].
We are concerned about the security of our sensitive experimental data collected by IoT sensors. What are the primary risks? The integration of IoT devices presents additional vulnerabilities, including uncertainty around data creation and storage locations, which can expose sensitive research intellectual property [82]. Key risks include:
- Unauthorized Access: Intellectual property and clinical trial results are highly valuable and targeted by cybercriminals [83].
- Insider Threats: Potential for data compromise, whether deliberate or inadvertent, from internal stakeholders [83].
- Third-Party Vendor Risks: Breaches suffered by vendors providing sensors or analytics platforms can lead to data loss [82].
What is the most effective way to justify the budget for a predictive maintenance system to our research directors? The most impactful way is to quantify the cost of equipment failure on research operations [84].
- List all assets critical to plant growth experiments (e.g., controlled-environment chambers, irrigation systems).
- For each asset, detail the remediation steps and costs if it fails.
- Calculate the cost to research operations while the asset is offline—including delayed results, compromised specimens, and lost researcher time [84]. These figures will justify investments in proactive maintenance.
Our pilot project was successful, but we are struggling to scale predictive maintenance facility-wide. What are the common hurdles? Scalability problems prevent 45-60% of successful pilots from achieving wider deployment [3]. This is often due to:
- Insufficient Data Infrastructure: Scaling requires a robust plan for deploying additional sensors and ensuring data quality across all new assets [3].
- Skills Gap: Limited expertise in data analytics and AI interpretation can delay value realization when moving beyond a controlled pilot [3].
- Integration Complexity: Siloed systems prevent comprehensive asset visibility. A phased rollout approach is critical to integrate new technologies without overwhelming existing systems and staff [81].
What are the typical success rates and resource requirements for a predictive maintenance implementation? Industry research reveals that 60-70% of predictive maintenance initiatives fail to achieve targeted ROI within the first 18 months [3]. However, facilities that systematically address challenges achieve 85-90% successful implementation rates [3]. Key resources should be allocated as follows [3]:
| Challenge Category | Occurrence Rate | Recommended Resource Allocation |
|---|---|---|
| Change Management & Training | 55-70% | 30-40% of total project resources |
| Data Infrastructure | 60-75% | 25-35% of total project resources |
| Technology Platform | 70-85% | 20-25% of total project resources |
Experimental Protocol: Implementing a Predictive Maintenance Framework for Plant Growth Chambers
This protocol outlines a methodology for deploying a predictive maintenance system to monitor critical plant growth chamber parameters, enabling the prediction of component failures before they disrupt research.
1. Sensor Deployment and Data Acquisition
- Objective: To collect real-time, high-fidelity data on the operational status of the growth chamber.
- Materials:
- IoT Vibration Sensors: Attach to condenser unit fans and circulating air fans to detect imbalances and bearing wear [55].
- IoT Infrared Thermography Sensors: Position to monitor electrical connections and compressor temperatures for "hotspots" indicating resistance or impending failure [55].
- Environmental Sensors: Utilize the chamber's built-in or supplementary sensors to log temperature, humidity, and CO2 levels.
- Data Acquisition Gateway: A device to aggregate sensor data and transmit it securely to the analysis platform.
2. Data Analysis and Alert Configuration
- Objective: To establish normal operational baselines and configure alerts for anomalous patterns.
- Methodology:
- Baseline Establishment: Allow the system to collect data from all sensors for a minimum of 4 weeks under standard research operating conditions to establish a performance baseline [3].
- Parameter Setting: Use the baseline data to set normal operational parameters (e.g., typical vibration amplitude, temperature ranges) for each sensor [55].
- Algorithm Training: Employ machine learning models to analyze historical data and recognize early signs of potential failures, such as a gradual increase in vibration or a slow drift in temperature control [11].
- Alert Logic: Configure the system to generate maintenance alerts when sensor readings fall outside established parameters or when predictive models forecast a high probability of failure within a given timeframe.
3. Validation and Refinement
- Objective: To validate prediction accuracy and refine the model.
- Methodology:
- When an alert is generated, technicians must perform a physical inspection and log the actual condition of the equipment.
- Compare predicted failures against actual maintenance findings to calculate the system's prediction accuracy.
- Use this feedback to continuously retrain and improve the machine learning models.
System Workflow and Data Security Visualization
Predictive Maintenance System Data Flow
Implementation Strategy Framework
The Researcher's Toolkit: Predictive Maintenance Essentials
The following table details key components for establishing a predictive maintenance framework in a research environment.
| Research Reagent Solution / Component | Function in Predictive Maintenance Context |
|---|---|
| IoT Vibration Sensors | Monitors rotating components (e.g., fans, pumps) in growth chambers for abnormal oscillations, indicating imbalance or bearing wear, allowing for early intervention [55]. |
| Infrared Thermography Camera | Detects "hotspots" in electrical panels and mechanical assemblies, identifying issues like loose connections or failing components before they cause system failure [55]. |
| Data Encryption Protocols | Protects sensitive experimental data collected by sensors, ensuring confidentiality and integrity during transmission and storage, which is critical for intellectual property security [83]. |
| Access Control & Classification System | Establishes strong access controls to guarantee only authorized research personnel can view or modify sensitive equipment data and predictive models [83]. |
| CMMS with AI Integration | A Computerized Maintenance Management System (CMMS) automates work order creation from sensor alerts. AI incorporation helps recognize fault patterns and suggests remediation actions [84]. |
Upskilling Research Staff for a Data-Driven Maintenance Workflow
Technical Support Center
Troubleshooting Guides
Q1: My environmental data seems inconsistent or my controller is making poor decisions. What should I check first?
A: Inconsistent data is often traced to sensor issues. Your environmental controller can only make good decisions if it receives accurate information [85].
- Action 1: Inspect and Clean Sensors: Dirty sensors are a primary cause of bad data. Regularly clean interior sensors, light meters, and external weather stations. Ensure sensors are positioned at crop level and are not in direct sunlight or in the path of water sprays [85].
- Action 2: Check Sensor Physical State: Look for sensors missing their protective shields and repair them. Verify the placement of all sensors [85].
- Action 3: Review System Configuration: A common issue is the heating and roof-vent-opening setpoints being programmed too close together (e.g., heat at 70°F, vent at 72°F), causing systems to work against each other. Spread out these setpoints to prevent this internal conflict [85].
Q2: I've just replaced a vent motor, but the system is still not working correctly. What did I miss?
A: After replacing a vent motor, you must re-time your environmental controller. Controllers are set to open or close vents in a specific length of time. A new motor with a different speed or stroke time will throw off the entire system, potentially causing extra wear or damage [85].
- Action: Consult your Operations and Maintenance (O&M) manual for the procedure to re-time the controller after motor repairs or replacements. This ensures the controller and motor work in sync [85].
Q3: My plant growth equipment is showing early signs of failure, like unusual vibrations. How can I confirm this with data?
A: Unusual vibrations are a key indicator of mechanical issues. You can use vibration analysis to monitor equipment health.
- Protocol: Vibration Analysis:
- Sensor Deployment: Install vibration sensors (e.g., accelerometers) on critical equipment like motors, agitators, or pumps.
- Baseline Establishment: Collect vibration data (frequency and amplitude) when the equipment is known to be operating normally.
- Continuous Monitoring: Use IoT systems to stream real-time vibration data to a central analytics platform [22] [86].
- Anomaly Detection: Machine learning models analyze the incoming data, comparing it to the baseline. Changes in vibration harmonics or frequencies can indicate issues like imbalance, misalignment, or bearing fatigue [22] [87].
- Alerting: The system generates an alert when vibrations exceed predefined thresholds, allowing for proactive intervention [88].
Q4: A critical piece of equipment has failed unexpectedly. What are my immediate steps?
A: Follow this protocol to minimize experimental impact:
- Step 1: Safety First: Secure the area and ensure all power to the equipment is disconnected if there is a safety hazard.
- Step 2: Consult O&M Manual: Refer to the equipment's Operations and Maintenance manual for specific troubleshooting guidance and emergency procedures [85].
- Step 3: Check for Simple Oversights: Verify that switches have not been left in "manual" mode and that breaker panels are correctly labeled and switched on [85].
- Step 4: Utilize Attic Stock: Check your designated spare parts inventory for components like fuses, fan belts, or motors to perform emergency repairs [85].
- Step 5: Document the Failure: Log all details of the failure—symptoms, time, and environmental conditions. This data is crucial for improving future predictive models and is essential for regulatory compliance [89].
Frequently Asked Questions (FAQs)
Q: What is the core difference between preventive and predictive maintenance? A: Preventive maintenance is performed on a fixed schedule (e.g., every 6 months), whether it is needed or not. Predictive maintenance is a data-driven, proactive method that analyzes equipment condition in real-time to forecast potential failures, allowing maintenance to be performed only when necessary [86]. This shift is illustrated in the workflow below.
Q: What quantitative benefits can we expect from a predictive maintenance program? A: Industry research demonstrates significant operational improvements from predictive maintenance, as shown in the table below [22].
Table 1: Operational Benefits of Predictive Maintenance
| Metric | Improvement Range |
|---|---|
| Reduction in Downtime | 35 - 45% |
| Elimination of Unexpected Breakdowns | 70 - 75% |
| Reduction in Maintenance Costs | 25 - 30% |
Q: What are the essential techniques for monitoring plant growth equipment? A: Several core condition-monitoring techniques form the foundation of a predictive maintenance program. The following table summarizes key methods and their applications [87] [86].
Table 2: Core Predictive Maintenance Techniques
| Technique | Measured Parameter | Common Application & Failure Mode Detected |
|---|---|---|
| Vibration Analysis | Vibration frequency and amplitude | Detects imbalance, misalignment, or bearing wear in motors, agitators, and pumps [87] [86]. |
| Thermography | Temperature variations | Identifies overheating components or electrical faults in control systems and motors [87] [86]. |
| Ultrasound | High-frequency sound waves | Detects air or water leaks, bearing defects, and electrical discharges [87]. |
| Oil Analysis | Lubricant contamination & quality | Reveals metal particles or lubricant degradation indicating internal wear in gearboxes and engines [87]. |
| Motor Circuit Analysis (MCA) | Voltage, current, resistance | Diagnoses insulation loss, winding defects, or rotor bar problems in electric motors [87]. |
Q: Our research is conducted under strict regulatory compliance (e.g., GMP). How does predictive maintenance support this? A: Predictive maintenance enhances compliance by providing automated, data-driven audit trails and real-time monitoring. This ensures continuous production and batch integrity, which aligns with regulations from agencies like the EMA. It turns maintenance from a reactive cost into a strategic, compliant differentiator [87] [89].
Q: What are the first steps to implementing a data-driven maintenance workflow? A: A successful implementation follows a structured roadmap, transitioning from foundational data collection to advanced analytics and continuous improvement, as shown in the protocol below [88].
The Scientist's Toolkit: Research Reagent Solutions for System Maintenance
Table 3: Essential Materials for Equipment Care
| Item | Function |
|---|---|
| Silver Bullet Roots | Adds oxygen to the root zone and helps control root disease, addressing issues like wilting or slow rooting [90]. |
| SuperThrive | A vitamin solution that helps destress plants affected by issues like tip burn or overfeeding [90]. |
| Pythoff | A treatment for Pythium root disease, which causes mushy brown roots [90]. |
| Pyrethrum 5 EC | A pesticide used to treat common pests like spider mites, thrips, and leaf miners, which cause white dots on leaves [90]. |
| Spare Fuses & Fan Belts | Inexpensive spare parts that can turn a crisis into a quick fix, minimizing equipment downtime [85]. |
| Spare Glazing Panels | Backup panels (glass, acrylic) or patch kits to quickly repair greenhouse leaks from hail or storm damage [85]. |
Proving the Value: ROI, Case Studies, and Comparative Analysis
Frequently Asked Questions (FAQs)
1. What are the key performance indicators (KPIs) for measuring the success of a predictive maintenance program? Success can be measured by tracking reductions in unplanned downtime, maintenance costs, and product waste, alongside increases in equipment reliability and lifespan. Key metrics include Mean Time Between Failures (MTBF), the cost of emergency repairs versus planned repairs, and the volume of waste or defective products diverted from landfills [91].
2. Our research equipment does not have integrated sensors. How can we start collecting data for predictive maintenance? You can retrofit existing equipment with external IoT-enabled sensors. A foundational setup includes vibration sensors for motors and pumps, thermal sensors for heat management systems, and data loggers for environmental parameters like humidity and temperature. Start by monitoring your most critical assets, such as controlled-environment growth chambers, where failure would have the greatest impact on your research [92] [60].
3. We see alerts from our monitoring system, but how do we know they are accurate and not false alarms? False alarms can be minimized by ensuring data quality and refining machine learning models. Begin with conservative thresholds for alerts and gradually refine them as the system collects more operational data. Techniques include cross-verifying alerts with multiple sensor readings (e.g., correlating a vibration alert with a temperature spike) and performing root-cause analysis on triggered alerts to improve the algorithm's accuracy over time [92].
4. How does predictive maintenance specifically help in reducing product waste in a research context? In plant growth research, equipment that operates outside specified parameters (e.g., incorrect light cycles, temperature fluctuations) can compromise experimental integrity, leading to lost or non-viable biological samples. Predictive maintenance ensures equipment functions correctly by identifying performance degradation early. This prevents deviations that could ruin sensitive experiments, thereby protecting valuable research samples and preventing the waste of associated costly growth media and reagents [93] [76].
Quantitative Impact of Predictive Maintenance
The following tables summarize documented performance improvements from implementing predictive maintenance strategies across various industries, which can serve as benchmarks for research applications.
Table 1: Reductions in Downtime and Costs
| Metric | Documented Reduction | Industry Context & Details |
|---|---|---|
| Unplanned Downtime | 30% - 50% [94] [93] | Manufacturing and industrial operations. One automotive manufacturer reduced unplanned stoppages by 45-60% [94]. |
| Maintenance Costs | 18% - 25% [95] [94] | Compared to traditional maintenance strategies. LLM-enhanced systems report 18% savings [95]. |
| Emergency Repair Costs | 60% - 75% lower than emergency repairs [95] | Planned interventions avoid overtime labor, expedited shipping, and premium parts pricing. |
Table 2: Improvements in Equipment and Product Quality
| Metric | Documented Improvement | Industry Context & Details |
|---|---|---|
| Equipment Lifespan | 20% - 40% extension [94] | Achieved by preventing catastrophic failures and associated collateral damage. |
| Defective Products / Waste | 40% - 60% reduction [95] | Prevents quality issues caused by degraded equipment performance before failure. |
| Return on Investment (ROI) | 10:1 to 30:1 ratios [94] | Leading organizations achieve this within 12-18 months of implementation. |
Experimental Protocols for Predictive Maintenance
Protocol 1: Deploying a Sensor Network for Condition Monitoring
Objective: To establish a foundational sensor network for collecting real-time data on critical plant growth research equipment.
Materials:
- Vibration sensors (for motors in environmental shakers, HVAC systems)
- Temperature and humidity sensors (for growth chambers, incubators)
- Data acquisition unit or IoT gateway
- Computerized Maintenance Management System (CMMS) or data analytics platform
Methodology:
- Asset Criticality Assessment: Identify equipment whose failure would critically impact research, such as phytotrons, bioreactors, or precision lighting systems.
- Sensor Selection and Placement: Install sensors on critical assets to monitor parameters indicative of performance. For example:
- Attach vibration sensors directly to motor housings.
- Mount temperature sensors near heat sources or cooling elements.
- Place humidity sensors in the core of the growth area, away from doors.
- Baseline Data Collection: Operate equipment under optimal conditions for a set period (e.g., 2-4 weeks) to establish a baseline for normal sensor readings.
- Define Alert Thresholds: Set initial, conservative thresholds for each sensor type. Alerts should trigger when data deviates significantly from the established baseline (e.g., ±2 standard deviations).
- Data Integration and Monitoring: Feed sensor data into a centralized platform (like a CMMS) for continuous monitoring, visualization, and alerting [92] [60].
Protocol 2: Developing a Predictive Model for Equipment Failure
Objective: To use collected sensor data to build a model that predicts equipment failures.
Materials:
- Historical time-series data from sensors
- Historical records of equipment failures and maintenance
- Data analytics software with machine learning capabilities
Methodology:
- Data Preparation: Clean and preprocess historical sensor data, labeling periods known to precede a failure.
- Feature Engineering: Identify key features from the sensor data that are most predictive of failure, such as:
- Increasing trend in vibration amplitude.
- Gradual rise in operating temperature.
- Abnormal noise patterns in acoustic data.
- Model Selection and Training: Train a machine learning model (e.g., Long Short-Term Memory (LSTM) network for time-series data) using the historical data. Use part of the data for training and a separate part for validation.
- Model Validation and Deployment: Validate the model's accuracy against the known failure events in your validation dataset. Once a satisfactory accuracy is achieved, deploy the model to analyze real-time data streams and generate predictions [17] [92].
- Continuous Improvement: Regularly retrain the model with new data to improve its predictive accuracy over time.
System Workflow and Architecture Diagrams
Predictive Maintenance Core Process
Predictive Maintenance System Architecture
The Scientist's Toolkit: Research Reagent Solutions
Table 3: Essential Materials for Predictive Maintenance Implementation
| Item | Function in Predictive Maintenance |
|---|---|
| Vibration Sensors | Monitor oscillatory movements in rotating equipment (e.g., motors, pumps) to detect imbalance, misalignment, or bearing wear [94] [92]. |
| Thermal Sensors & Cameras | Measure heat signatures to identify abnormal temperature rises caused by friction, electrical issues, or failing components [94] [76]. |
| Data Acquisition (DAQ) System | Acts as an interface between physical sensors and a computer, converting analog signals into digital data for processing and analysis. |
| Computerized Maintenance Management System (CMMS) | A software platform that centralizes data, automates work orders, manages maintenance history, and triggers alerts based on predictive insights [92] [76]. |
| Machine Learning Platform | Software used to build, train, and deploy predictive models that analyze historical and real-time data to forecast equipment failures [17] [92]. |
Technical Support Center
Troubleshooting Guides
Issue 1: Unexpected Vibration in a Tablet Press Machine
- Problem Description: A tablet press machine is producing an unusual, high-frequency vibration during operation. This anomaly was not present during the last production run.
- Required Data: Review the last 72 hours of vibration sensor data (frequency and amplitude) from the machine's main turret motor [76]. Check maintenance logs for recent parts replacements or calibration records [32].
- Diagnostic Steps:
- Isolate: Determine if the vibration is continuous or only occurs during specific operational phases (e.g., compression, ejection).
- Inspect: Visually check for loose components, misalignment, or signs of wear on punches and dies [76].
- Analyze: Compare current vibration signatures against baseline performance data. Look for patterns indicating specific faults like bearing wear or imbalance [96] [97].
- Resolution: If analysis confirms early-stage bearing wear, schedule a replacement during the next planned maintenance window. If the issue is misalignment, halt production for immediate corrective alignment to prevent product quality issues [98].
Issue 2: Gradual Temperature Rise in a Lyophilizer's Condenser
- Problem Description: The condenser unit of a freeze-drying machine shows a consistent, gradual increase in operating temperature over multiple cycles, threatening product efficacy.
- Required Data: Analyze time-series temperature data from the condenser inlet and outlet sensors. Cross-reference with vacuum level readings and compressor motor current draws [76].
- Diagnostic Steps:
- Correlate: Check if the temperature rise correlates with increased compressor amperage, suggesting overwork.
- Inspect: Examine the condenser coils for frost build-up or contamination that could impede heat transfer.
- Hypothesize: The data may point towards a slow refrigerant leak or a reduction in cooling efficiency [76].
- Resolution: Based on the diagnostic data, perform a leak test and system performance check. Schedule a refrigerant top-up and seal replacement if a leak is confirmed, avoiding unplanned shutdowns during a critical batch process.
Issue 3: Recurrent Fault in a Vial Filling Line
- Problem Description: A filling needle on an automated line intermittently fails to dispense the correct volume, leading to stoppages.
- Required Data: Extract all historical work orders and failure codes associated with this filling line from the CMMS [32]. Analyze data from flow sensors and positional encoders on the faulty needle.
- Diagnostic Steps:
- Historical Review: Use the CMMS to see if this is a recurring issue and what previous corrective actions were taken [32].
- Root Cause Analysis: Conduct a 5 Whys analysis [98]. For example:
- Why did the fill volume drop? The needle was partially clogged.
- Why was it clogged? The purging cycle was ineffective.
- Why was the purge ineffective? The air pressure was below the set threshold.
- Why was the pressure low? A regulator was failing intermittently.
- Why wasn't the failing regulator caught? It wasn't included in the sensor-based monitoring plan.
- Resolution: Replace the faulty regulator. Update the predictive maintenance model to include pressure regulator performance monitoring to prevent recurrence [76].
Frequently Asked Questions (FAQs)
Q1: What is the fundamental difference between preventive and predictive maintenance in a GMP environment? A1: Preventive maintenance is time-based, performed at scheduled intervals regardless of actual equipment condition. Predictive maintenance is condition-based, using real-time sensor data and analytics to perform maintenance only when needed, thereby minimizing unnecessary interventions in sterile areas and maximizing equipment uptime [96] [76].
Q2: What type of data is most critical for building an accurate predictive model for manufacturing equipment? A2: A combination of data sources is vital. This includes vibration data for rotating parts, temperature profiles for heating/cooling systems, pressure and flow rates for fluid systems, and electrical signals like motor current. This operational data must be integrated with historical maintenance logs and work order histories to contextualize the findings [96] [32] [76].
Q3: We have legacy equipment without built-in sensors. Can we still implement predictive maintenance? A3: Yes. You can retrofit legacy machines with low-cost, wireless IoT sensors for vibration, temperature, and other parameters. These sensors transmit data to an analytics platform, enabling a predictive maintenance capability without a full equipment replacement [97].
Q4: How does predictive maintenance directly support regulatory compliance (e.g., FDA, cGMP)? A4: It provides data-driven evidence of equipment reliability and consistent performance within validated parameters. Automated report generation in CMMS+ software ensures detailed, accurate maintenance logs for audits. More importantly, by ensuring equipment operates as intended, it directly safeguards product quality and patient safety, which is the core of cGMP [76].
Q5: What is a common pitfall when first implementing a predictive maintenance program? A5: A major challenge is data overload. Collecting vast amounts of data without a clear strategy for analysis and actionable insight generation is a common pitfall. Start with a focused pilot project on critical equipment, define clear key performance indicators (KPIs), and ensure you have the tools and skills to translate data into decisions [76].
Table 1: Common Equipment Failures and Predictive Monitoring Methods in Pharmaceutical Manufacturing
| Equipment | Common Failure Modes | Predictive Monitoring Parameters | Impact on Research & Production |
|---|---|---|---|
| HVAC Systems in Cleanrooms [76] | Filter clogging, Fan motor failure, Loss of pressure differential | Differential pressure, Particulate counts, Temperature, Humidity, Vibration on fan motors | Compromised sterile environment, invalidates research integrity, batch contamination risk. |
| Lyophilization Equipment [76] | Refrigerant leak, Vacuum pump failure, Heater mat degradation | Condenser temperature, Vacuum level, Shelf temperature profiles, Compressor amperage | Loss of product stability, failed batches, extended cycle times. |
| Tablet Press Machines [76] | Punch & die wear, Turret misalignment, Feeder system jam | Vibration analysis, Compression force monitoring, Feed frame motor current | Tablet weight/quality variation, dosage inconsistency, production halts. |
| Filling and Packaging Lines [76] | Nozzle clogging, Cap torquing failure, Label misapplication | Optical inspection data, Flow sensor data, Motor encoder data, Vibration on conveyors | Fill volume inaccuracy, packaging defects, reduced throughput. |
Table 2: Comparison of Maintenance Approaches
| Characteristic | Reactive Maintenance | Preventive Maintenance | Predictive Maintenance |
|---|---|---|---|
| Basis of Action | Run-to-failure [32] | Time/Schedule-based [76] | Actual Equipment Condition [96] [76] |
| Cost Implication | High emergency repair costs, production losses [98] | Higher parts/labor costs from unnecessary maintenance [76] | Lower long-term costs; maintenance only when needed [76] |
| Impact on Downtime | Unplanned, often lengthy [98] | Planned, but may not be necessary | Minimized unplanned downtime; planned, shorter interventions [96] [76] |
| Data Utilization | None (post-failure analysis only) | Historical failure averages | Real-time sensor data & advanced analytics (AI/ML) [96] [97] |
Experimental Protocols
Protocol 1: Deployment of a Wireless Vibration Sensor for Motor Health Assessment
1. Objective: To proactively identify imbalances, misalignment, or bearing wear in critical motor-driven assets (e.g., centrifuge drives, compressor motors) before functional failure. 2. Materials: * Wireless tri-axial vibration sensor with integrated temperature sensing [97]. * Magnetic or adhesive mounting base. * Cloud-based or on-premise data analytics platform. * Asset and sensor configuration software. 3. Methodology: * Sensor Placement: Mount the sensor on a clean, flat surface on the motor's bearing housing, ensuring a secure connection for accurate data transmission [97]. * Baseline Establishment: Collect vibration data (frequency in Hz, amplitude in g's) and temperature over a minimum 14-day period of normal operation to establish a healthy baseline signature. * Continuous Monitoring & Alerting: Configure the analytics platform to continuously monitor incoming data. Set alert thresholds for vibration velocity (e.g., mm/s RMS) and temperature deviations that trigger work orders in the CMMS. * Data Analysis: Use the platform's tools to analyze trends. An increasing trend in vibration amplitude at specific frequencies indicates developing faults, allowing maintenance scheduling days or weeks in advance [97].
Protocol 2: Root Cause Analysis (RCA) for Recurring Equipment Faults
1. Objective: To systematically identify the underlying, fundamental cause of a recurring equipment failure and implement a permanent corrective action. 2. Materials: * CMMS with complete equipment history [32]. * Cross-functional team (Maintenance, Engineering, Operations). * RCA tools: 5 Whys worksheet, Fishbone (Ishikawa) diagram [32]. 3. Methodology: * Problem Definition: Clearly and precisely define the problem, including the specific equipment, the failure mode, and its impact. * Data Collection: Gather all relevant data: maintenance history, sensor data logs, operator reports, and Standard Operating Procedures (SOPs). * 5 Whys Analysis: Engage the team to ask "Why?" successively until the root process or system failure is identified, not just a symptom. The analysis continues until a point where corrective action can be implemented effectively [98]. * Fishbone Diagram: Use the 6Ms (Machine, Method, Material, Man, Measurement, Mother Nature) as categories on the fishbone diagram to brainstorm all potential causes and identify relationships [32]. * Implement CAPA: Define and execute a Corrective Action (to fix the immediate root cause) and a Preventive Action (to prevent recurrence across the entire system) [98].
Workflow Visualization
Predictive Maintenance Logic Flow
Root Cause Analysis (5 Whys) Process
The Scientist's Toolkit: Essential Research Reagents & Materials
Table 3: Key Components for a Predictive Maintenance Research Setup
| Item / Solution | Function / Rationale |
|---|---|
| Wireless IoT Sensors (Vibration, Temperature, Pressure) [97] | To retrofit legacy equipment for real-time, non-intrusive condition monitoring and data acquisition without complex wiring. |
| Cloud-Based Analytics Platform [96] [76] | To store, process, and analyze large volumes of time-series sensor data using machine learning algorithms to identify failure patterns. |
| Computerized Maintenance Management System (CMMS+) [32] [76] | To automate work order generation, manage maintenance histories, track spare parts inventory, and provide audit trails for regulatory compliance. |
| Data Visualization & Dashboarding Tools [99] | To transform complex analytical results into intuitive graphs and charts, enabling researchers and technicians to quickly understand equipment health. |
| Root Cause Analysis (RCA) Toolkit (5 Whys, Fishbone Diagram) [32] [98] | Structured methodologies to move beyond symptoms and identify the fundamental, systemic cause of equipment failures. |
In the context of plant growth equipment research, where environmental consistency and equipment reliability are paramount for valid experimental outcomes, selecting an appropriate maintenance strategy is crucial. Maintenance approaches primarily fall into three categories: Reactive (fixing equipment after it fails), Preventive (performing routine, scheduled maintenance), and Predictive (using data to predict and prevent failures before they occur) [100]. For researchers and scientists, unplanned equipment failure can compromise months of sensitive experimentation, affecting data integrity and delaying critical drug development timelines. This analysis provides a structured comparison to guide the selection and implementation of the most effective maintenance strategy for research environments.
Core Concepts and Definitions
Reactive Maintenance
- Definition: A strategy of repairing parts or equipment only after a breakdown or run-to-failure has occurred [100].
- Context in Research: This approach may be applicable for non-critical assets whose failure does not pose a risk to the safety or integrity of an experiment. For example, a failed standalone lighting fixture in a non-experimental area might be addressed reactively without significant consequence.
Preventive Maintenance (PM)
- Definition: Also known as planned maintenance, this consists of maintenance tasks performed according to a scheduled plan (time-based or usage-based) while equipment is still operational to avoid unexpected breakdowns [100] [101].
- Context in Research: This is commonly used for critical plant growth chamber components. Examples include regularly scheduled calibration of sensors for temperature, humidity, and CO2, or the planned replacement of UV lamps in a photobiology study at fixed hourly intervals, regardless of their current condition.
Predictive Maintenance (PdM)
- Definition: An advanced, data-driven strategy that uses sensor data and analytics to monitor asset performance during normal operation, anticipating and predicting failures to allow for correction before they happen [100] [102].
- Context in Research: This approach is ideal for high-value, critical systems. For instance, vibration analysis on a chilled water pump for a growth room can forecast bearing failure weeks in advance, allowing maintenance to be scheduled during a planned experiment hiatus, thus avoiding a catastrophic failure that could alter growth conditions.
Comparative Analysis: Quantitative and Qualitative Data
The table below summarizes the core differences, benefits, and challenges of each maintenance strategy.
| Aspect | Reactive Maintenance | Preventive Maintenance (PM) | Predictive Maintenance (PdM) |
|---|---|---|---|
| Core Principle | Repair after failure [100] | Schedule-based maintenance [100] [101] | Condition-based maintenance [100] [102] |
| Maintenance Trigger | Equipment breakdown [100] | Calendar time or asset usage [101] | Data-driven alerts predicting failure [100] |
| Downtime | Unplanned and often prolonged [100] | Planned, but can be frequent [100] | Minimized; planned only when needed [101] |
| Cost Impact | High repair costs and production losses [103] | Higher parts inventory and potential for unnecessary maintenance [100] | Lower maintenance costs; reduced downtime (35-50%) [101] |
| Asset Utilization | Maximum, until failure [100] | Reduced due to planned stops [100] | Optimized; parts used to full lifespan [100] |
| Risk Level | High risk of collateral damage and experiment loss [100] | Risk of over-maintenance or unexpected failure between intervals [100] [17] | Lower risk; early detection of issues [103] |
| Ideal For | Non-critical, low-cost, or easily replaceable assets [101] | Assets with predictable failure patterns and low business impact [101] | Strategic, critical assets with high business impact [101] |
Workflow and Strategic Decision-Making
The following diagram illustrates the logical workflow for selecting and implementing a maintenance strategy for a piece of plant growth research equipment.
Diagram 1: Maintenance Strategy Decision Workflow
The Scientist's Toolkit: Research Reagent Solutions for PdM
Implementing a Predictive Maintenance strategy requires a suite of technological "reagents." The table below details the essential components and their functions in a PdM system for a research environment.
| Component Category | Specific Examples | Function in PdM Protocol |
|---|---|---|
| Sensors & Data Acquisition | Vibration, Temperature, Humidity, Acoustic, & CO2 Sensors; PLCs [104] [105] | Act as "primary antibodies," binding to physical parameters (vibration, heat) and converting them into digital data signals for analysis. |
| Data Integration & Communication | IoT Gateways; IO-Link Technology; CMMS/EAM [102] [105] | Function as "buffer solutions," creating a stable pipeline for secure and reliable data transmission from sensors to the analytics platform. |
| Analytics & Detection | AI & Machine Learning Algorithms; Statistical Process Control [103] [104] [101] | Serve as the "assay," processing the data stream to establish a healthy baseline and detect anomalous patterns that signal future failure. |
| Visualization & Action | Predictive Maintenance Dashboards; Automated Work Orders [102] [105] | Act as the "detection substrate," providing a clear, visual output (alerts, health scores) that prompts researcher or technician intervention. |
Experimental Protocols for PdM Implementation
Protocol 1: Pilot Deployment for a Critical Asset
This protocol outlines a step-by-step methodology for initiating a PdM strategy on a single, critical piece of equipment, such as an environmental control unit for a plant growth chamber.
- Step 1: Component Selection & Parameter Definition: Identify critical assets whose failure would most impact research. Prioritize based on safety, experiment quality, and availability [103]. Define the control parameters to monitor (e.g., vibration, temperature, motor current) [103].
- Step 2: Technology Stack Definition: Select appropriate sensor hardware (vibration, thermal) and non-destructive testing tools (ultrasonic, oil analysis) [103] [101]. Choose an IIoT platform and ensure integration with existing data historians or CMMS [105].
- Step 3: Baseline Establishment & Data Collection: Install sensors and collect operational data during normal equipment function to establish a baseline "healthy" state [104]. This phase must capture data across various operational cycles.
- Step 4: Model Training & Alert Thresholding: Use machine learning algorithms to analyze the baseline data and learn normal operating patterns. Define thresholds for anomalies that will trigger maintenance alerts [104].
- Step 5: Predictive Intervention & Validation: Execute the first predictive work orders. Validate the model's accuracy by comparing predictions to actual equipment condition upon inspection. Refine the model iteratively [103].
Protocol 2: Failure Mode Simulation for Model Training
In a research setting, run-to-failure data is often unavailable. This protocol describes how to simulate failure data to train predictive algorithms.
- Objective: To generate synthetic data representing equipment degradation, enabling the training of accurate ML models without causing actual equipment failure.
- Methodology:
- Failure Mode Effects Analysis (FMEA): Assemble a team of equipment specialists and researchers to identify potential failure modes for a target asset (e.g., bearing wear in a pump) [104].
- Controlled Parameter Deviation: In a controlled, non-experimental setting, intentionally induce minor, non-destructive stress that mimics early degradation. For example, slightly imbalance a fan to simulate early-stage bearing wear.
- Data Capture: During the simulation, collect high-fidelity sensor data (vibration, temperature) to capture the "signature" of the incipient failure.
- Data Labeling and Model Injection: Label this simulated data as "early fault condition" and use it to augment the healthy baseline data for training the predictive algorithm, improving its ability to recognize pre-failure conditions [104].
Technical Support Center: FAQs and Troubleshooting
FAQ 1: Our predictive model is generating too many false alerts. How can we improve its accuracy?
- Potential Cause: Insufficient or poor-quality training data.
- Troubleshooting Steps:
- Data Audit: Verify that sensors are functioning correctly and transmitting continuous, clean data. Intermittent data can cause false anomalies [104].
- Review Baselines: Ensure the "healthy" baseline model is built from data that represents all normal operating states of the equipment (e.g., different seasons, startup vs. steady-state) [104].
- Refine Thresholds: Adjust the alert thresholds. Overly sensitive thresholds can trigger alerts for normal operational variations. Use statistical process control to set meaningful limits [103].
FAQ 2: We are facing internal resistance from our research team in adopting new PdM workflows. How can we manage this change?
- Potential Cause: Lack of buy-in and understanding of the benefits.
- Troubleshooting Steps:
- Secure Stakeholder Buy-in: Early on, communicate the benefits to all stakeholders, focusing on how PdM protects their research from downtime and data loss [104].
- Develop Training Materials: Create training that explains not just how to use the new tools, but also the reason for the new strategy and how it benefits their work directly [104].
- Start with a Pilot: Begin with a small, successful pilot project on a problematic asset. Demonstrating a quick win, such as preventing a specific chamber failure, can build momentum and credibility [103] [104].
FAQ 3: What is the biggest challenge when scaling a PdM pilot to our entire research facility?
- Potential Cause: The complexity of managing larger amounts of data and coordinating more installations.
- Troubleshooting Steps:
- Build on Success: Apply the lessons and refined processes from the pilot project to subsequent rollouts [104].
- Phased Expansion: Add only a few machines or systems at a time. This keeps the increase in data and workflow changes manageable [104].
- Maintain ROI Focus: Prioritize scaling to assets with the highest potential return on investment through avoided downtime and protected research, ensuring continued support and funding [104].
Troubleshooting Common Predictive Maintenance Challenges
Q: Our predictive maintenance system is generating alerts, but we are not seeing a reduction in downtime. What could be wrong? A: This common issue often stems from alert fatigue or a lack of actionable insight. Ensure your system is tuned to prioritize alerts based on failure criticality and asset importance. Focus on the Pf (Potential Failure) to F (Functional Failure) interval, acting on early warnings to give your planning team sufficient time to develop procedures and schedule parts and labor [106]. Furthermore, verify that sensor data is being trended over time and compared against established baselines; a single out-of-range reading is less valuable than a trend indicating progressive degradation [107].
Q: How can we justify the initial investment in predictive maintenance technologies to financial stakeholders? A: Use industry benchmark data to build your business case. Proactive maintenance strategies can yield 30-40% savings compared to reactive maintenance and 8-12% compared to preventive maintenance [108]. Frame the investment in terms of risk mitigation against unplanned downtime, which costs Fortune Global 500 companies a total of $1.4 trillion annually, with automotive manufacturers facing losses of $2.3 million per hour [109]. The return on investment typically manifests within 6-12 months through reduced downtime, lower repair costs, and extended asset life [110] [111].
Q: We have a mix of new and legacy equipment. How can we implement a predictive maintenance program effectively? A: Start with a criticality analysis of your assets. Focus initial implementation on high-value, critical equipment where unexpected failure would have the most significant impact on research or production [106]. For legacy assets, use portable data collectors for periodic condition monitoring (e.g., vibration pens, ultrasonic meters) rather than costly permanent sensor installations [106]. For newer, connected equipment, integrate IoT sensors for continuous, real-time monitoring. A CMMS is essential for unifying data from both old and new assets into a single, actionable system [110] [112].
Benchmarking Data for Maintenance Cost Reduction
The following tables summarize key industry statistics that validate the potential for significant cost reduction through advanced maintenance strategies.
Table 1: Financial Impact of Maintenance Strategies
| Metric | Reactive Maintenance Impact | Proactive Maintenance Impact | Source |
|---|---|---|---|
| Cost Savings | Baseline | 30-40% vs. Reactive; 8-12% vs. Preventive | [108] |
| Downtime Reduction | 3.3x more downtime | 44% reduction after investment | [109] |
| Defect Rate | 16x more defects | 54% reduction in defect rate | [109] |
| Lost Sales (Defects) | 2.8x more lost sales | 35% fewer lost sales | [109] |
Table 2: Unplanned Downtime Costs by Industry
| Industry / Sector | Cost of Unplanned Downtime | Source |
|---|---|---|
| Fortune Global 500 | $1.4 trillion annually (11% of revenue) | [109] |
| Average across industries | $108,000 per hour | [109] |
| Automotive Manufacturing | $2.3 million per hour | [109] |
| Small-Medium Enterprises (SMEs) | Up to $150,000 per hour | [109] |
Experimental Protocol: Implementing a Predictive Maintenance Program
This protocol provides a step-by-step methodology for establishing a predictive maintenance program for critical plant growth chambers or bioreactors.
Objective: To systematically deploy a condition-based monitoring program that predicts asset failures, reduces maintenance costs by 25-30%, and minimizes unplanned downtime.
Materials & Equipment:
- CMMS (Computerized Maintenance Management System)
- Vibration analysis sensors or handheld analyzers
- Infrared thermography camera
- Ultrasonic analysis microphone
- Oil analysis kits (for mechanical assets with lubrication systems)
Procedure:
Asset Criticality Analysis: Identify and prioritize equipment based on their impact on research operations. Criticality is determined by factors such as:
- Cost of replacement and lead time.
- Impact on research integrity if failure occurs.
- Role in the overall production or research pipeline.
Baseline Data Collection: For each prioritized asset, establish a baseline of normal operating conditions.
- Vibration: Use sensors to measure and record baseline vibration signatures (displacement, velocity, frequency) under normal load [112].
- Thermal: Use an IR camera to capture thermal images of electrical panels, motor bearings, and other critical components to establish normal operating temperatures [106] [107].
- Ultrasonic: Record baseline ultrasonic signatures for bearings and steam traps to identify normal acoustic patterns [106] [112].
Define Alert Thresholds: In your CMMS, set multi-level alerts (e.g., advisory, warning, critical) based on the baseline data and manufacturer specifications. This ensures technicians are notified of deviations that indicate potential failure modes [107].
Integration and Monitoring: Integrate all sensor data streams into the CMMS. Implement a schedule for:
- Continuous Monitoring: For the most critical assets with fixed sensors.
- Periodic Route-Based Monitoring: For less critical assets, using handheld data collectors [106].
Work Order Generation and Execution: Configure the CMMS to automatically generate work orders when an alert threshold is breached. The work order should include the asset's history, the specific alert condition, and the recommended corrective action.
Analysis and Refinement: Regularly review maintenance data and Key Performance Indicators (KPIs) such as Mean Time To Repair (MTTR) and Overall Equipment Effectiveness (OEE). Use this analysis to refine alert thresholds and improve maintenance strategies continuously [108] [113].
Predictive Maintenance System Workflow
The diagram below illustrates the logical workflow of an integrated predictive maintenance system, from data collection to continuous improvement.
The Scientist's Toolkit: Essential Predictive Maintenance Technologies
Table 3: Key Predictive Maintenance Tools and Their Functions
| Tool / Technology | Primary Function | Typical Application in Research Context |
|---|---|---|
| Vibration Analysis Sensors | Monitor vibration frequency and intensity to detect mechanical faults [107] [112]. | Rotating equipment such as environmental chamber compressors, mixer motors, and centrifuges. |
| Infrared Thermography Camera | Detects abnormal heat signatures indicating electrical/mechanical stress [106] [107]. | Inspecting electrical panels, motor control centers, and steam lines for growth sterilizers. |
| Ultrasonic Analysis Microphone | Detects high-frequency sounds from leaks and bearing failures [106] [112]. | Locating compressed air/gas leaks; assessing bearing condition in pumps and fans. |
| Motor Circuit Analyzer | Assesses the electrical health of motor systems while operating [107] [112]. | Predictive testing of motors driving critical bioreactors or HVAC systems. |
| CMMS Software | Central platform for scheduling, work orders, asset history, and data analytics [110] [109]. | The core system for managing all maintenance operations, inventory, and data trends. |
| Oil Analysis Kits | Measures lubricant properties and wear particles to determine internal machine wear [107]. | Monitoring wear in pumps, gearboxes, and other lubricated mechanical systems. |
Evaluating the Accuracy and ROI of Different Predictive Maintenance Types
For researchers managing sophisticated plant growth equipment, such as controlled-environment chambers, lighting systems, and precision irrigation units, unplanned downtime can disrupt critical experiments, invalidate longitudinal data, and compromise years of meticulous work. Predictive maintenance (PdM) represents a strategic evolution from reactive repairs and rigid preventive schedules to a data-driven, condition-based approach. By using real-time monitoring to assess the actual state of equipment, PdM enables interventions to be performed precisely when needed—before failure occurs but without the wasted resources of unnecessary maintenance [114].
This guide provides a technical framework for evaluating the accuracy and financial return on investment (ROI) of various predictive maintenance techniques. It is specifically tailored for research and development settings where equipment reliability is directly linked to data integrity and research outcomes.
Core Predictive Maintenance Techniques: Accuracy and Application
Different PdM techniques are sensitive to different failure modes. Selecting the right technology depends on the equipment type and the specific parameters you need to monitor. The following table summarizes the five most prevalent techniques.
Table 1: Core Predictive Maintenance Techniques and Their Characteristics
| Technique | Primary Measured Parameter | Common Failure Modes Detected | Typical Equipment Applications |
|---|---|---|---|
| Vibration Analysis [115] [116] | Frequency and amplitude of oscillation | Imbalance, misalignment, bearing defects, mechanical looseness | Pumps, fans, motors, compressors—any rotating asset |
| Infrared Thermography [115] [116] | Temperature and heat patterns | Overheating bearings, loose electrical connections, failing components, insulation breakdown | Electrical panels, motors, steam systems, building envelopes |
| Oil Analysis [115] [116] | Lubricant properties and contaminants | Internal wear, lubricant degradation, contamination (dirt, water) | Gearboxes, hydraulic systems, engines, any oil-lubricated machinery |
| Acoustic Monitoring [115] [116] | High-frequency sound waves (Ultrasonic) | Early-stage bearing failure, crack formation, leaks, electrical arcing | Pressure vessels, pipelines, low-speed rotating machinery |
| Ultrasonic Testing [116] | Airborne high-frequency sound | Compressed air leaks, steam trap failures, electrical discharge | Compressed air systems, steam systems, electrical inspections |
Quantitative Accuracy and ROI of PdM Techniques
Implementing a predictive maintenance program requires a clear understanding of its potential benefits. Industry data demonstrates that organizations consistently achieve significant improvements in reliability and cost savings.
Table 2: Documented Performance and ROI of Predictive Maintenance Programs
| Performance Metric | Industry-Documented Result | Citation |
|---|---|---|
| Reduction in Maintenance Costs | 25-30% (Average); Up to 40% | [115] [117] [116] |
| Reduction in Unplanned Downtime | 35-50% (Average); Up to 85% | [115] [117] [116] |
| ROI Timeframe | Payback in 12-36 months; up to 10x ROI reported | [117] [7] |
| Failure Prediction Accuracy | AI-driven systems can achieve up to 90% accuracy | [7] |
| Advance Warning of Failure | Vibration analysis can provide 2-6 months of warning for rotating equipment | [115] |
Implementation and Troubleshooting for Research Facilities
Experimental Protocol: Deploying a Vibration Analysis Pilot
A phased, pilot-based approach is recommended for validating PdM in a research context.
Phase 1: Assessment and Planning (Weeks 1-2)
- Objective: Identify critical assets whose failure would most impact research operations (e.g., HVAC systems controlling growth chamber environments, recirculating pumps in hydroponic systems).
- Action: Select 3-5 high-priority assets for the pilot study. Establish a baseline of normal vibration signatures for each asset under standard operating conditions.
Phase 2: Technology Deployment and Data Collection (Weeks 3-10)
- Objective: Collect and analyze vibration data to detect anomalies.
- Action: Install accelerometers on the bearing housings of the selected assets. Use a Fast Fourier Transform (FFT) analyzer to convert time-domain vibration signals into frequency-domain spectra for precise fault identification [115] [118]. Collect data at regular intervals (e.g., weekly).
Phase 3: Analysis and Validation (Ongoing)
- Objective: Correlate vibration data with equipment health and plan maintenance.
- Action: When the analysis software flags an anomaly (e.g., a vibration pattern indicating a specific bearing fault), generate a work order. Schedule the repair during a planned downtime. After maintenance, document the finding to validate the prediction and refine the model.
Frequently Asked Questions (FAQs)
Q1: Our growth chambers are critical. Can predictive maintenance prevent all failures? A: While highly effective, PdM cannot prevent every single failure. Its success is highest for assets with predictable failure modes, such as rotating machinery. It is less effective for random electronic component failures or failures caused by external factors like power surges. A comprehensive strategy combines PdM for critical components with robust preventive maintenance for other systems [114].
Q2: We found a potential bearing fault via vibration analysis. How urgent is this? A: The urgency is determined by the P-F Interval [118]. The Potential Failure (P) is the point the fault was detected. The Functional Failure (F) is when the bearing seizes. The time between P and F is your window to plan. With vibration analysis often providing weeks or months of warning [115], you can order the correct part and schedule the repair during a planned experiment changeover, avoiding disruptive emergency repairs.
Q3: What is the fundamental difference between preventive and predictive maintenance? A: Preventive Maintenance (PM) is calendar-based or runtime-based, performing maintenance at fixed intervals regardless of the equipment's actual condition. Predictive Maintenance (PdM) is condition-based, using real-time sensor data to determine the actual health of the equipment and schedule maintenance only when needed [114] [116]. This eliminates unnecessary maintenance and prevents failures that occur between PM intervals.
Q4: We have a limited budget. What is the most cost-effective PdM technique to start with? A: For a research facility, infrared thermography is a strong starting point. A single thermal imaging camera can be used to safely inspect a wide range of assets—from electrical panels and motor connections to steam lines and building seals—without requiring permanent sensor installations on every piece of equipment, making it highly versatile for an initial investment [116].
The Researcher's Toolkit: Essential PdM Solutions
Implementing a predictive maintenance program requires a combination of hardware, software, and analytical tools.
Table 3: Predictive Maintenance Research Reagent Solutions
| Tool Category | Specific Examples | Primary Function in PdM Experiments |
|---|---|---|
| Sensors & Data Acquisition | Accelerometers, Thermal Cameras, Ultrasonic Microphones, Oil Sampling Kits | Capture real-time physical parameters (vibration, temperature, sound, lubricant quality) from research equipment. |
| Data Analytics & Visualization | CMMS with Analytics, FFT Analyzers, Machine Learning Platforms | Process sensor data, perform frequency analysis, identify patterns and anomalies, and visualize equipment health trends. |
| Reference Standards | ISO 10816 (Vibration Severity), Historical Baseline Data | Provide benchmarks for comparing measured data against established norms to objectively assess asset condition. |
| Integration Platform | Computerized Maintenance Management System (CMMS) | Serves as the central hub for aggregating sensor data, triggering automated alerts, and generating work orders. |
Strategic Decision-Making and Future Outlook
Decision Framework for PdM Adoption
Choosing the right predictive maintenance path depends on your facility's maturity and specific research reliability goals. The following diagram outlines the strategic decision-making process.
Emerging Trends in Predictive Maintenance
The future of PdM is being shaped by several key technologies that promise even greater accuracy and autonomy:
- Artificial Intelligence (AI) and Machine Learning: AI models are increasing failure prediction accuracy to over 90% by identifying subtle correlations across massive datasets that are invisible to traditional methods [7].
- Digital Twins: Creating a virtual replica of physical equipment, such as a growth chamber, allows researchers to simulate performance under various conditions and predict failures without disrupting ongoing experiments [7].
- Edge Computing: This technology processes sensor data locally on the device (at the "edge" of the network), instead of sending it to the cloud. This drastically reduces latency, enabling real-time analysis and immediate automated responses to critical conditions [7].
Conclusion
The adoption of predictive maintenance for plant growth equipment represents a pivotal advancement for the biomedical research sector, transitioning maintenance from a cost center to a strategic asset. By synthesizing the foundational knowledge, methodological steps, troubleshooting tactics, and validated outcomes, this framework demonstrates that a data-driven approach is no longer optional but essential for ensuring experimental reproducibility, safeguarding valuable research, and maximizing operational efficiency. Future directions will involve deeper integration of AI for even more precise Remaining Useful Life predictions and the expansion of PdM principles to create fully autonomous, self-optimizing research environments, ultimately accelerating the pace of drug development and clinical discovery.
References
- 1. How to Maintain Plant Growth Chambers [https://www.conviron.com/insights/how-to-maintain-plant-growth-chambers/]
- 2. What is Predictive Maintenance? 5 Steps to Prevent Failure [https://matterport.com/blog/predictive-maintenance?srsltid=AfmBOor0RfrS2PSQjJSMPkHa5-sXdlJneMe4F7i557DBeDg7V9gDhoXZ]
- 3. Challenges in Implementing Predictive Maintenance [https://www.oxmaint.com/blog/post/challenges-in-implementing-predictive-maintenance]
- 4. Overcoming predictive maintenance challenges - IFM [https://www.ifm.com/us/en/us/predictive-maintenance/overcoming-predictive-maintenance-challenges-complete-guide?srsltid=AfmBOoqkVggGy7lUo_PJmDExnbGWFhJcPSy9soVGorKHhGVKF4QBNaXN]
- 5. FutureMain Showcases Operational AI-Based Equipment ... [https://www.prnewswire.com/apac/news-releases/futuremain-showcases-operational-aibased-equipment-diagnostics-at-adipec-2025-accelerating-reliability-and-innovation-in-the-energy-sector-302619884.html]
- 6. Minimizing Downtime with Predictive Maintenance in ... [https://mathco.com/casestudies/minimizing-unplanned-downtime-with-predictive-maintenance-in-the-manufacturing-process/]
- 7. 8 Trends Shaping the Future of Predictive Maintenance [https://worktrek.com/blog/predictive-maintenance-trends/]
- 8. Enabling predictive maintenance in the laboratory [https://www.luxoft.com/case-studies/enabling-predictive-maintenance-in-the-laboratory]
- 9. The Hidden Costs of Lab Equipment Downtime | Download [https://flagshipinc.com/hidden-costs-lab-equipment-downtime/]
- 10. 5 Quick Tips on How to Reduce Downtime in Pharma ... [https://pharmadocx.com/how-to-reduce-downtime-in-pharma-industry/]
- 11. Predictive Maintenance in Agriculture: Equipment ... [https://arshon.com/blog/predictive-maintenance-in-agriculture-equipment-longevity-resource-utilization/]
- 12. Predictive and Preventive Maintenance [https://www.plantengineering.com/predictive-and-preventive-maintenance/]
- 13. Understanding the Real Costs of Machine Downtime in ... [https://www.output.industries/insights/costs-of-machine-downtime-in-manufacturing]
- 14. Identifying and Addressing Issues in the Grow Room [https://emeraldharvest.co/troubleshooting-identifying-and-addressing-issues-in-the-grow-room/]
- 15. 10 Most Common Indoor Growing Problems & How to Fix ... [https://www.gorillagrowtent.com/blogs/news/10-most-common-indoor-growing-problems?srsltid=AfmBOoortOX87Tc-l2gLhH4ZlM_TFp_3qM8MdOySJ0nimQt67uVAM4ee]
- 16. Plant Lighting Troubleshooting Guide [https://www.nexsel.tech/plant-lighting-troubleshooting.php?srsltid=AfmBOopIeixA59ZdJZN4xJhusEzgbFQGona2g6X33L_m9zheoM77LCcp]
- 17. Predictive maintenance system for high-end equipment in ... [https://www.sciencedirect.com/science/article/abs/pii/S147403462400154X]
- 18. Tips for Troubleshooting Plant Health [https://growtentsdepot.com/blogs/news/reviving-your-grow-tent-garden-tips-for-troubleshooting-plant-health?srsltid=AfmBOopgFphaOLxYqhuxI0vwQC-jqdiObarBWL2LYgvvs6kHC1xoVsGP]
- 19. We Answered Your Predictive Maintenance Questions [https://cwservices.com/we-answered-your-predictive-maintenance-questions/]
- 20. Predictive Maintenance: Definition, FAQs, Solutions & More [https://www.brightlysoftware.com/blog/benefits-predictive-maintenance]
- 21. Integrating AI and IoT for Predictive Maintenance in ... [https://www.mdpi.com/2078-2489/16/9/737]
- 22. Predictive Maintenance Machine Learning: A Practical Guide [https://www.neuralconcept.com/post/how-ai-is-used-in-predictive-maintenance]
- 23. Predictive Maintenance with IoT and AI: Reduce Downtime ... [https://oxmaint.com/blog/post/predictive-maintenance-iot-ai]
- 24. Predictive Maintenance in Manufacturing: IoT Data to AI ... [https://www.sphereinc.com/blogs/predictive-maintenance-in-manufacturing-iot-data/]
- 25. AI in Predictive Maintenance: Benefits & Use Cases 2025 [https://americanchase.com/ai-in-predictive-maintenance/]
- 26. 2025 Guide to Implementing AI Predictive Maintenance in ... [https://www.linkedin.com/pulse/2025-guide-implementing-ai-predictive-maintenance-qv6ve]
- 27. Predictive Maintenance Solutions Using AI and IoT [https://www.wildnetedge.com/blogs/predictive-maintenance-ai-smart-solutions-for-equipment-reliability]
- 28. Predictive maintenance market: 5 highlights for 2024 and ... [https://iot-analytics.com/predictive-maintenance-market/]
- 29. Guide to Predictive Maintenance [https://voliro.com/blog/predictive-maintenance/]
- 30. Overcoming predictive maintenance challenges - IFM [https://www.ifm.com/us/en/us/predictive-maintenance/overcoming-predictive-maintenance-challenges-complete-guide?srsltid=AfmBOoqvQaoQBw9QqvmTiJ7PussnKcrkHGWJupna77YTZHA7ZQDTeXNJ]
- 31. 5 Steps to Troubleshooting That Will Fix Just About Anything [https://limblecmms.com/learn/maintenance-operations/troubleshooting/]
- 32. A Guide to Maintenance Troubleshooting | ATS [https://www.advancedtech.com/blog/maintenance-troubleshooting/]
- 33. Analytics Considerations When Implementing Predictive ... [https://www.jeffwinterinsights.com/insights/analytics-considerations-when-implementing-predictive-maintenance]
- 34. What is FMEA? Failure Mode & Effects Analysis [https://asq.org/quality-resources/fmea?srsltid=AfmBOoo8B9dvkk02VQs1-CMQZzWpP2XYO9mAXlitEgGtALoYIWjp9yJC]
- 35. Comprehensive Guide to FMEA Analysis Techniques [https://www.scrut.io/post/guide-to-an-fmea-analysis]
- 36. Understanding Equipment Failure Patterns and the Predictive ... [https://f7i.ai/blog/understanding-equipment-failure-patterns-and-the-predictive-maintenance-advantage]
- 37. How Equipment Fails, Understanding the 6 Failure Patterns [https://accendoreliability.com/equipment-fails-understanding-6-failure-patterns/]
- 38. IoT Sensors: A Comprehensive Guide [https://safetyculture.com/topics/internet-of-things/iot-sensors]
- 39. Wireless Vibration Sensors - Plant Equipment Remote ... [https://www.phaseivengr.com/products/sensors/vibration-accelerometer/]
- 40. IoT FAQs [https://www.losant.com/iot-faqs]
- 41. Essential Guide to Troubleshooting Common Sensor Issues in ... [https://www.nexisense.com/industry/Essential-Guide-to-Troubleshooting-Common-Sensor-Issues-in-IoT-Systems.html]
- 42. Troubleshoot the sensor - Microsoft Defender for IoT [https://learn.microsoft.com/en-us/azure/defender-for-iot/organizations/how-to-troubleshoot-sensor]
- 43. Understanding Predictive Maintenance - Data Acquisition ... [https://towardsdatascience.com/understanding-predictive-maintenance-data-acquisition-and-signal-denoising-0309b1b103a7/]
- 44. Data Preprocessing in Data Mining [https://www.geeksforgeeks.org/data-science/data-preprocessing-in-data-mining/]
- 45. How to Implement Data Analytics for Predictive ... [https://worktrek.com/blog/how-to-implement-predictive-maintenance-analytics/]
- 46. Data Cleaning & Data Preprocessing for Machine Learning [https://encord.com/blog/data-cleaning-data-preprocessing/]
- 47. A survey of deep learning-driven architecture for predictive ... [https://www.sciencedirect.com/science/article/pii/S0952197624004433]
- 48. LSTM Debugging: Top Techniques for Troubleshooting Models [https://neuralbrainworks.com/lstm-debugging-top-techniques-for-troubleshooting-models/]
- 49. Long short-term memory (LSTM) networks for precision ... [https://www.nature.com/articles/s41598-025-06809-w]
- 50. How to fix a common mistake in LSTM time series forecasting [https://medium.com/@srmousavi25/how-to-fix-a-common-mistake-in-lstm-time-series-forecasting-4d4d51d9948f]
- 51. LSTM Advanced Tutorial: Techniques & Projects in 2025 [https://neuralbrainworks.com/lstm-advanced-tutorial-techniques-projects-in-2025/]
- 52. Improving OCR Accuracy with LSTM Networks [https://www.linkedin.com/pulse/improving-ocr-accuracy-lstm-networks-practical-guide-srikanth-r-kfdnc]
- 53. The Ultimate Guide to Alarm Management for Asset ... [https://www.racoman.com/blog/the-ultimate-guide-to-alarm-management-for-asset-management-specialists-in-the-groundwater-management-industry?srsltid=AfmBOoove6yJ8F8j1zlh0dY1vyFYRdt_GohLJBNegaXmNh6FYQ4VW7Ml]
- 54. Integrated Operation With Maintenance Alarm On An Asset ... [https://www.yokogawa.com/library/resources/yokogawa-technical-reports/integrated-operation-with-maintenance-alarm-on-an-asset-management-system/]
- 55. The Definitive Guide to Predictive Maintenance [https://www.gofmx.com/predictive-maintenance/]
- 56. Establishing a Predictive Maintenance Program Step-by-Step [https://sensemore.io/establishing-a-predictive-maintenance-program-step-by-step/?srsltid=AfmBOopkuGwoLln7HCtbgSNDkyPShMHujUoOb7Z7sPuz22XlMzVybr_M]
- 57. These experts reveal all you need to know about asset ... [https://www.plantengineering.com/these-experts-reveal-all-you-need-to-know-about-asset-management/]
- 58. How to boost OEE with asset management [https://www.plantengineering.com/how-to-boost-oee-with-asset-management/]
- 59. Implementing a predictive maintenance strategy - IFM [https://www.ifm.com/us/en/us/predictive-maintenance/implementing-predictive-maintenance-a-strategic-guide?srsltid=AfmBOoobCupBJ_w_snbUm0ul0MeWEkkXumrVZuzzCfZ7RGp7xDSeAsmE]
- 60. Reducing equipment downtime with predictive ... [https://www.explorewms.com/reducing-equipment-downtime-with-predictive-maintenance-strategies.html]
- 61. Predictive Maintenance: Overcoming Common Data ... [https://www.verytechnology.com/whitepapers/predictive-maintenance-adoption-overcoming-data-quality-issues]
- 62. The Role of Predictive Analytics in Preventing Plant Failures [https://www.maintwiz.com/blog/the-role-of-predictive-analytics-in-preventing-plant-failures-strategies-and-techniques/]
- 63. How does a high false positive rate affect process plants? [https://precog.co/glossary/false-positive-rate/]
- 64. You're Doing Predictive Maintenance Wrong — Here's Why [https://www.assetwatch.com/blog/why-predictive-maintenance-fails]
- 65. Predicting machine failures using machine learning and ... [https://www.sciencedirect.com/science/article/pii/S2667344424000124]
- 66. Overcoming predictive maintenance challenges - IFM [https://www.ifm.com/us/en/us/predictive-maintenance/overcoming-predictive-maintenance-challenges-complete-guide?srsltid=AfmBOoocWkiAe0EXYfiUzUxREZlir8Xeefg7wLQGjMIUlZ_4bDWQYaNN]
- 67. Overcoming IT/OT convergence challenges for predictive ... [https://www.plantengineering.com/overcoming-it-ot-convergence-challenges-for-predictive-maintenance-in-process-manufacturing/]
- 68. Understanding SPC Alarms: How Manufacturers Use Data ... [https://www.dataparc.com/blog/understanding-spc-alarms-how-to-improve-quality/]
- 69. Statistical Process Control (SPC): The Ultimate Guide [2025] [https://www.6sigma.us/six-sigma-in-focus/statistical-process-control-spc/]
- 70. Process Alarm Management Best Practices [https://www.dataparc.com/blog/best-practices-for-process-alarm-management/]
- 71. The process of effective predictive maintenance [https://www.plantengineering.com/the-process-of-effective-predictive-maintenance/]
- 72. Exploring the Distinctions: Root Cause Analysis ... [https://precog.co/blog/exploring-the-distinctions-root-cause-analysis-optimization-and-predictive-maintenance-tools/]
- 73. Predictive vs Prescriptive Analytics: Key Differences [https://www.tableau.com/analytics/predictive-analytics-vs-prescriptive-analytics]
- 74. Predictive vs Prescriptive Analytics. Definition & Examples [https://www.qlik.com/us/predictive-analytics/predictive-vs-prescriptive-analytics]
- 75. How AI Root Cause Analysis Improves Maintenance ... [https://llumin.com/blog/how-ai-root-cause-analysis-improves-maintenance-decisions/]
- 76. Predictive Maintenance in Pharmaceutical Manufacturing [https://llumin.com/blog/predictive-maintenance-in-pharmaceutical-manufacturing/]
- 77. The strategic role of predictive maintenance in the pharma ... [https://resources.sw.siemens.com/en-US/white-paper-strategic-role-predictive-maintenance-pharma-industry/]
- 78. Top Plant Maintenance Challenges - With Solutions [https://worktrek.com/blog/top-plant-maintenance-challenges/]
- 79. How Root Cause Analysis Improves Preventive Maintenance [https://www.linkedin.com/advice/0/how-do-you-identify-address-root-causes-2f]
- 80. A marketer's guide to descriptive, predictive, diagnostic ... [https://business.adobe.com/blog/basics/descriptive-predictive-prescriptive-analytics-explained]
- 81. How To Overcome Cultural and Technological Barriers ... [https://www.reliableplant.com/Read/32577/how-to-overcome-cultural-and-technological-barriers-when-transitioning-to-proactive-maintenance]
- 82. Cybersecurity Challenges in the Pharma Industry [https://www.fortinet.com/solutions/industries/pharma/cybersecurity-challenges-in-the-pharma-industry]
- 83. Data Security Challenges in Pharma IT: Safeguarding ... [https://www.pharmafocuseurope.com/articles/data-security-challenges-in-pharma-it-safeguarding-sensitive-information]
- 84. Your questions answered: Using software in predictive ... [https://www.plantengineering.com/your-questions-answered-using-software-in-predictive-maintenance/]
- 85. Greenhouse Maintenance: 7 Must-Know Troubleshooting ... [https://www.prospiant.com/greenhouse-maintenance-and-troubleshooting-7-tips-every-grower-should-know/]
- 86. Predictive maintenance: the key data-driven technique for ... [https://www.iberdrola.com/about-us/our-innovation-model/predictive-maintenance]
- 87. The Role of Predictive Maintenance in Pharma Industry [https://www.icareweb.com/knowledge/predictive-maintenance/predictive-maintenance-pharma-industry/]
- 88. How to Capitalize on Predictive Maintenance Data Analytics [https://www.tmasystems.com/resources/predictive-maintenance-data-analytics]
- 89. Enabling Predictive Maintenance in Pharma Equipment ... [https://www.azilen.com/blog/predictive-maintenance-in-pharma/]
- 90. Troubleshooting Guide for Growing [https://www.growell.co.uk/blogs/news/plant-troubleshooting-guide]
- 91. What Metrics Can Quantify the Environmental Impact ... [https://lifestyle.sustainability-directory.com/learn/what-metrics-can-quantify-the-environmental-impact-reduction-from-predictive-paas-maintenance/]
- 92. How to Reduce Downtime with a Predictive Maintenance ... [https://llumin.com/blog/how-to-reduce-downtime-with-a-predictive-maintenance-cmms/]
- 93. Enabling Waste Reduction via Predictive Maintenance [https://www.bearingpoint.com/en-us/insights-events/insights/enabling-waste-reduction-via-predictive-maintenance/]
- 94. How Predictive Maintenance Drives Cost Savings [https://worktrek.com/blog/predictive-maintenance-cost-savings/]
- 95. The ROI of LLM-Enhanced Predictive Maintenance [https://www.oxmaint.com/blog/post/predictive-maintenance-roi-32-percent-downtime-reduction]
- 96. Predictive Maintenance for Pharma [https://www.aspentech.com/en/cp/predictive-maintenance-for-pharma]
- 97. All About Pharmaceutical Predictive Maintenance [https://nanoprecise.io/predictive-maintenance-in-pharmaceutical-industry/]
- 98. Equipment Failure in Pharmaceutical Manufacturing [https://www.pharmaguideline.com/2025/04/equipment-failure-in-pharmaceutical-manufacturing.html]
- 99. Predictive Maintenance Data Visualization Guide [https://www.meegle.com/en_us/advanced-templates/predictive_maintenance/predictive_maintenance_data_visualization_guide]
- 100. Reactive Vs. Preventive Vs. Predictive Maintenance [https://www.prometheusgroup.com/resources/posts/reactive-vs-preventive-vs-predictive-maintenance]
- 101. Preventive Maintenance vs. Predictive Maintenance [https://www.ibm.com/think/topics/predictive-vs-preventive-maintenance]
- 102. Predictive Maintenance FAQ | Condition-Based PdM ... [https://www.maintwiz.com/learning-center/predictive-maintenance-faq/]
- 103. Switching From Reactive to Predictive Maintenance [https://kaizen.com/insights/reactive-predictive-maintenance/]
- 104. Overcoming predictive maintenance challenges - IFM [https://www.ifm.com/us/en/us/predictive-maintenance/overcoming-predictive-maintenance-challenges-complete-guide?srsltid=AfmBOoomaoUc4pFabaDAWoNIfLcBv0esvm5KO3Zt8AagPHL6puD6gF7X]
- 105. Asset Optimization: Predictive Maintenance [https://www.deloitte.com/us/en/services/consulting/services/predictive-maintenance-and-the-smart-factory.html]
- 106. Predictive Maintenance Explained [https://www.reliableplant.com/Read/12495/preventive-predictive-maintenance]
- 107. 5 Types of Predictive Maintenance Techniques [https://limblecmms.com/learn/predictive-maintenance/techniques/]
- 108. Maintenance statistics and trends 2025 [https://blog.infraspeak.com/maintenance-statistics-trends-challenges/]
- 109. 30 Key Maintenance Statistics & Facts Highlighting 2026 Trends [https://coastapp.com/blog/maintenance-metrics-statistics-facts/]
- 110. 8 Best Tools for Predictive Maintenance [https://worktrek.com/blog/predictive-maintenance-tools/]
- 111. Top 8 Predictive Maintenance Tools to Revolutionize ... [https://imaintain.uk/top-8-predictive-maintenance-tools-to-revolutionize-equipment-management/]
- 112. 5 Best Predictive Maintenance Tools [https://limblecmms.com/learn/predictive-maintenance/tools/]
- 113. Transforming Drug Development: A Lilly–Covance Case ... [https://www.pharmexec.com/view/transforming-drug-development-a-lilly-covance-case-study]
- 114. CMMS vs Predictive Maintenance: Which is Right for Your ... [https://oxmaint.com/blog/post/cmms-vs-predictive-maintenance]
- 115. 5 Types of Predictive Maintenance You Need to Know About [https://worktrek.com/blog/predictive-maintenance-types/]
- 116. 5 Types of Predictive Maintenance Techniques [https://www.getmaintainx.com/blog/types-of-predictive-maintenance-techniques]
- 117. Predictive Maintenance in Manufacturing: ROI Guide & ... [https://www.oxmaint.com/blog/post/predictive-maintenance-in-manufacturing]
- 118. Fan Predictive Maintenance: The 2025 Ultimate Guide [https://f7i.ai/blog/the-ultimate-guide-to-fan-predictive-maintenance-in-2025-from-theory-to-roi]