Unlocking Plant Immunity: A Comprehensive Guide to BSR-Seq for Disease Resistance Gene Discovery
This article provides a detailed roadmap for researchers, scientists, and biotech professionals on utilizing Bulk Segregant RNA-Sequencing (BSR-Seq) to identify plant disease resistance genes.
Unlocking Plant Immunity: A Comprehensive Guide to BSR-Seq for Disease Resistance Gene Discovery
Abstract
This article provides a detailed roadmap for researchers, scientists, and biotech professionals on utilizing Bulk Segregant RNA-Sequencing (BSR-Seq) to identify plant disease resistance genes. We cover foundational concepts of BSR-Seq and plant-pathogen interactions, deliver a step-by-step methodological protocol, address common troubleshooting and optimization challenges, and validate the approach through comparative analysis with other gene mapping techniques. The guide synthesizes current best practices to accelerate the identification of R genes, offering insights for developing durable crop protection strategies and informing biomedical analogies in host-pathogen research.
Understanding BSR-Seq: The Foundation for Rapid Gene Mapping in Plant Immunity
This document provides detailed application notes and protocols for Bulk Segregant Analysis (BSA) and its evolution into modern RNA-Seq-based methods, framed within the context of a doctoral thesis research program focused on identifying plant disease resistance (R) genes using Bulk Segregant RNA-Seq (BSR-Seq). The integration of BSA with transcriptome profiling (RNA-Seq) significantly enhances the precision and efficiency of mapping and characterizing genes underlying monogenic and polygenic traits, particularly in non-model plant species.
Principles and Evolution of BSA to RNA-Seq
Core Principles of Classical BSA
BSA is a genetic mapping strategy that identifies genomic regions associated with a specific phenotype by comparing pooled DNA samples from individuals with contrasting traits (e.g., resistant vs. susceptible). The core principle relies on the differential frequency of parental alleles in the bulked pools. For a qualitative trait controlled by a single locus, the region harboring the causal gene will show a drastic shift in allele frequency towards one parent in the selected bulk, while unlinked regions will have a ~50:50 allele frequency.
Evolution to Next-Generation Sequencing (NGS) and RNA-Seq
The advent of NGS transformed BSA by enabling high-density, genome-wide polymorphism detection without prior marker development. This led to approaches like QTL-seq and SHOREmap. The logical next step was BSR-Seq, which utilizes RNA instead of DNA. BSR-Seq simultaneously performs bulked segregant analysis and transcriptome profiling by sequencing the mRNA from phenotypically contrasting pools. This provides two critical data streams: 1) SNP markers for genetic mapping, and 2) gene expression data that can directly implicate candidate genes within the mapped interval.
Table 1: Comparison of BSA-Based Mapping Approaches
| Method | Primary Material | Key Outputs | Typical Population Size | Key Advantage | Major Limitation |
|---|---|---|---|---|---|
| Classical BSA (Microsatellites/AFLPs) | Genomic DNA | Linked marker region | 20-50 individuals per bulk | Low-tech, cost-effective for targeted mapping | Low marker density, labor-intensive |
| QTL-seq | Genomic DNA (Whole-genome) | SNP-index plot, QTL regions | 20-50 individuals per bulk | Genome-wide, high resolution | Does not provide functional data |
| MutMap | Genomic DNA (Mutant population) | SNP-index for induced mutations | 1 bulk of mutant individuals | Rapid gene cloning in mutants | Applicable only to mutant backgrounds |
| BSR-Seq | RNA (Transcriptome) | SNP-index plot + Differential Expression | 15-30 individuals per bulk | Combines genetic mapping & expression profiling | Requires gene expression in sampled tissue |
Table 2: Typical Sequencing Requirements for BSA/BSR-Seq (Plant Studies)
| Method | Recommended Sequencing Depth per Bulk (for diploids) | Common Platform | Approximate Coverage for Mapping |
|---|---|---|---|
| QTL-seq | 20-30x genome coverage | Illumina NovaSeq/HiSeq | 1.0-2.0x physical coverage of target region |
| BSR-Seq | 30-50 million paired-end reads per bulk | Illumina NextSeq/NovaSeq | SNP calling + sufficient transcript depth |
Detailed Experimental Protocols
Protocol: Plant Population Development for BSR-Seq (Disease Resistance)
Objective: Generate an F2 segregating population from parents with contrasting disease resistance phenotypes.
- Crossing: Cross a disease-resistant parent (P1) with a susceptible parent (P2) to generate F1 hybrids.
- Selfing: Self-pollinate F1 plants to produce an F2 population (segregates for resistance).
- Phenotyping: Inoculate ~200-500 F2 seedlings with the pathogen using a standardized assay (e.g., spray inoculation, detached leaf assay). Include parental and F1 controls.
- Scoring: At the peak disease stage, score each plant using a categorical (resistant/susceptible) or quantitative (lesion number/size) scale.
- Bulk Construction: Select ~20-30 extreme phenotypic individuals each for the "Resistant Bulk" (R-bulk) and "Susceptible Bulk" (S-bulk). Avoid intermediate phenotypes. Tissue samples (e.g., leaves, inoculated tissue) are flash-frozen in liquid N2.
Protocol: RNA Extraction, Library Prep, and Sequencing for BSR-Seq
Objective: Prepare high-quality, strand-specific RNA-Seq libraries from constructed bulks.
- Tissue Homogenization: Grind frozen tissue to a fine powder under liquid N2 using a mortar and pestle or bead mill.
- Total RNA Extraction: Use a commercial kit (e.g., Qiagen RNeasy Plant Mini Kit) with on-column DNase I digestion to eliminate genomic DNA contamination. Assess RNA integrity (RIN > 8.0) using an Agilent Bioanalyzer.
- mRNA Enrichment & Library Construction: Use poly-A selection beads to enrich for mRNA. Construct strand-specific, Illumina-compatible libraries using a kit such as the NEBNext Ultra II Directional RNA Library Prep Kit. Include unique dual indexes for sample multiplexing.
- QC and Sequencing: Quantify libraries by qPCR (e.g., Kapa Biosystems kit). Pool libraries at equimolar ratios. Sequence on an Illumina platform (e.g., NextSeq 2000) to generate a minimum of 30 million 150-bp paired-end reads per bulk.
Protocol: Computational Analysis for BSR-Seq
Objective: Identify genomic regions associated with resistance and candidate genes.
- Data Preprocessing: Trim adapters and low-quality bases with Trimmomatic. Align clean reads to a reference genome using a splice-aware aligner (e.g., HISAT2, STAR).
- Variant Calling: Use GATK best practices for RNA-Seq SNP calling. Identify polymorphic sites between parental lines.
- SNP-Index Calculation: Calculate the SNP-index for each bulk at each polymorphic site: (Number of reads with mutant/resistant allele) / (Total reads at that position). Generate ΔSNP-index plots (ΔSNP-index = SNP-index(R-bulk) – SNP-index(S-bulk)).
- QTL Region Identification: Define candidate regions where the ΔSNP-index significantly deviates from 0 (e.g., >0.8 or < -0.8) using statistical confidence intervals (e.g., 99% CI based on simulation).
- Differential Expression (DE) Analysis: Use featureCounts and DESeq2/R edgeR to identify genes within the candidate QTL region that are differentially expressed between R- and S-bulks. Integrate SNP and DE data to prioritize candidate R genes (e.g., genes with non-synonymous SNPs in coding regions and significant differential expression).
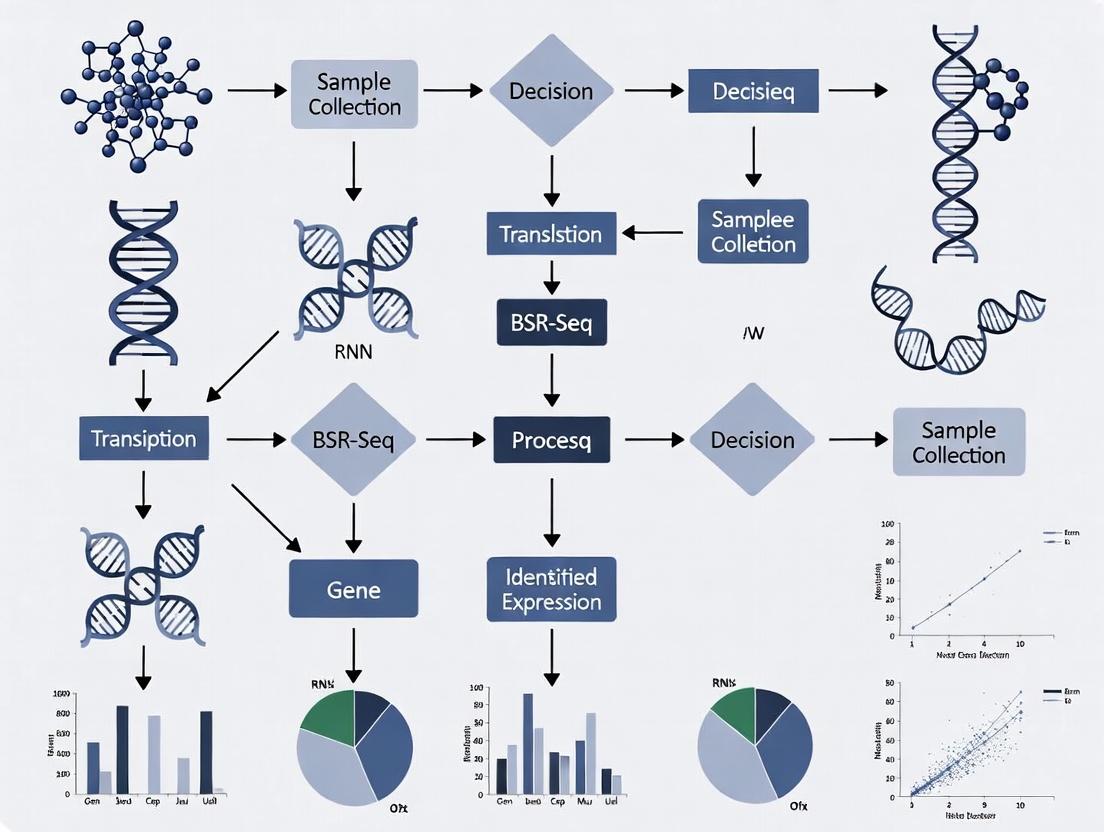
Diagrams
Title: BSR-Seq Experimental and Computational Workflow
Title: Evolution of BSA Methods from Low-Throughput to BSR-Seq
The Scientist's Toolkit: Key Research Reagent Solutions
Table 3: Essential Materials for BSR-Seq in Plant Disease Research
| Item | Function in Protocol | Example Product/Kit |
|---|---|---|
| RNA Stabilization Solution | Prevents RNA degradation immediately upon tissue sampling. Critical for capturing accurate transcriptional states. | RNAlater (Invitrogen), RNAstable (Biomatrica) |
| Plant-Specific RNA Extraction Kit | Efficiently purifies high-quality, intact total RNA from polysaccharide and polyphenol-rich plant tissues. | RNeasy Plant Mini Kit (Qiagen), Plant RNA Purification Kit (Norgen) |
| DNase I (RNase-free) | Removes contaminating genomic DNA during RNA purification to ensure pure RNA for sequencing. | DNase I, RNase-free (Thermo Fisher), On-column DNase (Qiagen) |
| Stranded mRNA Library Prep Kit | Prepares Illumina-compatible, strand-specific RNA-Seq libraries from poly-A RNA. Essential for accurate transcript assembly. | NEBNext Ultra II Directional RNA Library Prep (NEB), TruSeq Stranded mRNA (Illumina) |
| Dual Indexing Oligos | Allows multiplexing of multiple samples in a single sequencing run, reducing cost per sample. | IDT for Illumina UD Indexes, NEBNext Multiplex Oligos |
| High-Fidelity DNA Polymerase | Used in library amplification steps to minimize PCR errors and bias during library construction. | Q5 High-Fidelity DNA Polymerase (NEB), KAPA HiFi HotStart ReadyMix (Roche) |
| Pathogen Inoculum / Elicitor | Used to challenge the plant population to induce the disease resistance phenotype and associated gene expression. | Purified fungal spores (e.g., Magnaporthe oryzae), Bacterial suspension (e.g., Pseudomonas syringae), Fig22 peptide |
The Crucial Role of Disease Resistance (R) Genes in Plant-Pathogen Interactions
Application Notes
Resistance (R) genes are foundational components of the plant immune system, encoding proteins that recognize specific pathogen effectors (Avirulence or Avr factors) to trigger robust defense responses, often culminating in the Hypersensitive Response (HR). Within the thesis context of utilizing Bulk Segregant RNA-Seq (BSR-Seq) for rapid R-gene identification, understanding their molecular function and genetic architecture is paramount for effective experimental design and data interpretation.
Core Principles for BSR-Seq-Based R-Gene Discovery:
- Genetic Basis: R genes often reside in complex loci with paralogs and high sequence similarity, complicating mapping. BSR-Seq overcomes this by integrating phenotypic segregation with transcriptomic data.
- Recognition Mechanisms: Direct (receptor-ligand) or indirect (guard/decoy) effector recognition leads to dramatic transcriptional reprogramming, a signal captured by BSR-Seq differential expression analysis.
- Signaling Outputs: Successful recognition activates calcium influx, Reactive Oxygen Species (ROS) bursts, MAPK cascades, and massive phytohormone (SA, JA/ET) signaling shifts, all of which alter the transcriptome pool for bulked segregant analysis.
Key Quantitative Parameters for R-Gene Characterization:
Table 1: Key Quantitative Metrics for R-Gene Characterization & BSR-Seq Design
| Parameter | Typical Range/Value | Significance for BSR-Seq Research |
|---|---|---|
| Mapping Population Size | 100-500 F2 individuals | Determines mapping resolution and statistical power for SNP identification. |
| BSR-Seq Bulk Size | 20-30 extreme phenotype plants per bulk | Balances cost and allele frequency detection sensitivity. |
| Expected Read Depth (BSR-Seq) | 50-100x per bulk | Ensures sufficient coverage for SNP calling and allele frequency estimation. |
| Candidate Region Resolution | 1-5 cM (reducible to <1 Mb) | Defines the genomic interval for candidate gene mining post-BSR-Seq. |
| NLR Gene Length | 3-5 kb (coding sequence) | Informs primer design and sequencing requirements for validation. |
| HR Response Timing | 6-48 hours post-inoculation | Critical for determining RNA sampling timepoint in BSR-Seq experiments. |
Experimental Protocols
Protocol 1: BSR-Seq Workflow for R-Gene Identification
Objective: To rapidly map and identify candidate R genes using transcriptome sequencing of phenotypically selected bulks from a segregating population.
Materials: Segregating plant population (F2 or RILs), pathogenic isolate with known Avr profile, RNA extraction kit, mRNA-seq library prep kit, sequencing platform, bioinformatics software (FastQC, Trimmomatic, HISAT2/BWA, GATK, SnpEff, R/qtl).
Procedure:
- Population Inoculation & Phenotyping: Inoculate the entire mapping population (~200 individuals). Score for disease resistance/susceptibility using a standardized scale at the appropriate time post-inoculation.
- Bulk Construction: Select 20-30 individuals representing each phenotypic extreme (resistant bulk 'R-bulk', susceptible bulk 'S-bulk'). Tissue sampling (e.g., leaf) should be done at the onset of HR (for R-bulk) or first symptoms (for S-bulk).
- RNA Extraction & Sequencing: Extract total RNA from each individual within a bulk. Pool equal quantities of RNA from all individuals within the R-bulk and separately within the S-bulk. Construct paired-end mRNA-seq libraries for each pool. Sequence each library to a depth of ~75-100 million reads on an Illumina platform.
- Bioinformatic Analysis:
- Quality Control & Alignment: Trim adapters, filter low-quality reads. Align clean reads to the reference genome using a splice-aware aligner.
- SNP Calling & Filtering: Call variants (SNPs/InDels) in each bulk. Filter for high-confidence, biallelic SNPs.
- ΔSNP-index Calculation: For each SNP position, calculate the SNP-index (frequency of the alternate allele) in the R-bulk and S-bulk. Derive the ΔSNP-index (R-bulk index minus S-bulk index).
- Mapping: Plot the ΔSNP-index across all chromosomes. A region where ΔSNP-index approaches 1 or -1 (indicating near-fixation of opposite alleles between bulks) represents the linked genomic region harboring the R gene.
- Candidate Gene Identification: Within the mapped interval, annotate genes, prioritizing those encoding canonical R protein domains (NBS-LRR, RLK, RLP). Use differential expression analysis (R-bulk vs. S-bulk) to further prioritize candidates.
Protocol 2: Functional Validation of Candidate R Genes via Transient Expression
Objective: To confirm the function of a candidate R gene by co-expressing it with its cognate Avr effector and observing HR.
Materials: Candidate R gene clone in an expression vector (e.g., pEAQ-HT), Agrobacterium tumefaciens strain GV3101, Nicotiana benthamiana plants (4-5 weeks old), syringe or needleless syringe.
Procedure:
- Clone Construction: Clone the full-length coding sequence of the candidate R gene into a plant expression vector. Obtain the putative cognate Avr effector gene clone.
- Agrobacterium Preparation: Transform constructs into A. tumefaciens. Grow single colonies in selective media, induce with acetosyringone.
- Infiltration: Mix bacterial cultures carrying the R gene and the Avr effector (OD600 ~0.5 each). Co-infiltrate into panels on N. benthamiana leaves using a syringe. Include controls: R gene alone, Avr alone, empty vector.
- Phenotypic Scoring: Monitor infiltrated areas for 2-5 days for the appearance of confluent HR cell death (collapsed, desiccated tissue), indicating a specific recognition event.
Visualizations
Diagram 1: BSR-Seq workflow for R gene identification.
Diagram 2: Indirect R-Avr recognition via guard mechanism.
The Scientist's Toolkit
Table 2: Essential Research Reagents & Solutions for R-Gene Studies
| Reagent/Solution | Function & Application | Key Considerations |
|---|---|---|
| Stable Isogenic Pathogen Lines | Provide consistent Avr effector expression for phenotype assays and R gene screening. | Essential for defining gene-for-gene relationships. |
| Near-Isogenic Lines (NILs) | Plant lines differing only at the target R gene locus, minimizing background genetic noise. | Critical for clean comparative transcriptomics and validation. |
| Gateway-compatible Plant Expression Vectors (e.g., pEAQ-HT, pGWB) | Enable rapid, high-throughput cloning and transient/stable expression of candidate R and Avr genes. | Vector choice affects expression level (constitutive/inducible) and tag presence. |
| Agrobacterium tumefaciens Strain GV3101 (pMP90) | Standard workhorse for transient expression in N. benthamiana and stable plant transformation. | Optimized for virulence, widely compatible with binary vectors. |
| RNA Stabilization Solution (e.g., RNAlater) | Preserves RNA integrity in plant tissues post-harvest, especially crucial for time-course studies of defense responses. | Vital for obtaining high-quality input for BSR-Seq. |
| NLR Domain-Specific PCR Primers | Degenerate or conserved primers for amplifying NBS-LRR gene fragments from genomic DNA or cDNA. | Useful for initial candidate gene surveys in mapped regions. |
| Phytohormone Analysis Kits (SA, JA, JA-Ile) | Quantitative measurement of defense signaling molecules via ELISA or LC-MS/MS. | Correlates R gene activation with downstream signaling pathways. |
| Reactive Oxygen Species (ROS) Detection Dyes (e.g., DAB, H2DCFDA) | Histochemical or fluorescent detection of oxidative bursts, a hallmark early HR event. | Provides rapid, visible confirmation of R protein activation. |
Within the broader thesis on Bulked Segregant RNA-Seq (BSR-Seq) for plant disease resistance gene identification, this protocol details the comprehensive workflow. BSR-Seq integrates traditional genetic mapping with high-throughput RNA sequencing to rapidly identify genetic loci and candidate genes associated with a phenotypic trait of interest, such as disease resistance. It is particularly powerful for species without a reference genome or for traits with complex genetic control.
Application Notes
BSR-Seq is a cost-effective method that leverages both phenotypic segregation and allele frequency differences between pooled samples (bulks). By comparing the RNA-Seq data from two bulks exhibiting extreme phenotypes (e.g., resistant vs. susceptible), researchers can identify single nucleotide polymorphisms (SNPs) linked to the trait. The concurrent transcriptome data provides immediate candidate gene information within the mapped interval. Key advantages include no requirement for prior genome information for mapping, simultaneous expression profiling, and rapid candidate gene discovery.
Detailed Protocols
Protocol 1: Plant Population Development and Phenotyping
Objective: To generate a segregating population and perform rigorous, quantitative phenotyping for bulk construction.
- Crossing: Cross a resistant parent (P1) with a susceptible parent (P2) to generate F1 progeny. Self or intercross F1 plants to create a segregating F2 or recombinant inbred line (RIL) population.
- Inoculation: Inoculate all individuals in the segregating population with the pathogen under controlled, standardized conditions. Include replicate plants per genotype and repeated experimental runs.
- Quantitative Phenotyping: Score disease symptoms at predetermined time points post-inoculation. Use a standardized scale (e.g., 0-5 for symptom severity, 0-100% for lesion area). For resistance, common metrics include:
- Disease Index (DI)
- Incubation Period (IP)
- Lesion Size (LS)
- Data Analysis: Calculate summary statistics (mean, standard deviation) for each genotype or treatment. Perform ANOVA to confirm significant phenotypic variation attributable to genotype.
Protocol 2: Bulk Construction and RNA Extraction
Objective: To create phenotypically extreme bulks and extract high-quality total RNA.
- Bulk Assembly: Rank all individuals from the segregating population based on the quantitative phenotypic score. Select 20-30 individuals from each extreme (e.g., most resistant, most susceptible) to form the Resistant (R-bulk) and Susceptible (S-bulk) pools.
- Tissue Sampling: Collect equivalent tissue (e.g., leaf tissue at the infection front) from each selected plant at a defined physiological and infection time point. Flash-freeze in liquid nitrogen.
- RNA Extraction:
- Grind tissue to a fine powder under liquid nitrogen.
- Use a commercial plant RNA extraction kit (e.g., Qiagen RNeasy Plant Mini Kit) following the manufacturer's protocol, including on-column DNase I digestion.
- Quantify RNA concentration using a fluorometer (e.g., Qubit). Assess integrity via Bioanalyzer or TapeStation (RNA Integrity Number, RIN > 7.0 is recommended).
Protocol 3: Library Preparation, Sequencing, and Bioinformatic Analysis
Objective: To generate and analyze RNA-Seq data for SNP identification and allele frequency calculation.
- Library Preparation: Use a stranded mRNA-seq library preparation kit (e.g., Illumina TruSeq Stranded mRNA). Fragment 1 µg of total RNA, synthesize cDNA, add adapters, and PCR-amplify with index primers for multiplexing.
- Sequencing: Pool libraries and sequence on an Illumina platform (NovaSeq 6000, HiSeq 4000) to generate 100-150 bp paired-end reads. Aim for a minimum depth of 30-50 million reads per bulk.
- Bioinformatic Pipeline:
- Quality Control: Use FastQC and Trimmomatic to assess read quality and trim adapters/low-quality bases.
- Alignment: Align cleaned reads to a reference genome (if available) using HISAT2 or STAR. For non-model species, perform de novo transcriptome assembly of the reads from both bulks combined using Trinity.
- Variant Calling: Use SAMtools mpileup and BCFtools, or GATK, to call SNPs from the aligned reads. Filter SNPs (e.g., depth > 10, quality > 20).
- Δ(SNP-index) Calculation: For each SNP, calculate the SNP-index in each bulk (ratio of reads carrying the alternate allele to total reads). Compute the Δ(SNP-index) = (SNP-index in R-bulk) - (SNP-index in S-bulk).
- Association Mapping: Plot the Δ(SNP-index) values across the genome/transcripts. Use a sliding window approach (e.g., 1-4 Mb window with 10-100 kb steps) to smooth data. The genomic region where Δ(SNP-index) significantly deviates from 0 (theoretically ~1 for a perfectly linked SNP) is the candidate locus.
Protocol 4: Candidate Gene Identification and Validation
Objective: To prioritize genes within the mapped locus and initiate validation.
- Locus Definition: Define the candidate region based on the peak of the Δ(SNP-index) plot (e.g., region where Δ(SNP-index) > 0.8).
- Gene Annotation & Prioritization: Extract all genes/transcripts within the candidate region from the annotation file. Cross-reference with differential expression analysis (e.g., DESeq2) between R- and S-bulks. Prioritize genes that are both located in the locus and differentially expressed. Further prioritize genes with known resistance-related domains (e.g., NBS-LRR, receptor-like kinases).
- Validation: Design primers for Kompetitive Allele-Specific PCR (KASP) or cleaved amplified polymorphic sequence (CAPS) markers flanking the candidate SNP. Genotype the original segregating population to confirm linkage between the marker and the phenotype.
Data Presentation
Table 1: Example Phenotypic Data Summary for Bulk Selection
| Phenotype Bulk | Number of Plants | Mean Disease Index (±SD) | Range | Selection Criteria |
|---|---|---|---|---|
| Resistant (R) | 25 | 15.2 (± 3.1) | 10-20 | DI ≤ 20 |
| Susceptible (S) | 25 | 85.5 (± 5.8) | 75-95 | DI ≥ 75 |
| Total Population (F2) | 180 | 48.7 (± 28.3) | 8-98 | - |
Table 2: Key Sequencing and Mapping Metrics
| Metric | Resistant Bulk (R) | Susceptible Bulk (S) |
|---|---|---|
| Total Raw Reads | 48,567,890 | 46,987,221 |
| Q30 Percentage | 92.5% | 91.8% |
| Reads Aligned to Genome | 44,102,345 (90.8%) | 42,345,876 (90.1%) |
| Total SNPs Called | 1,245,678 | 1,198,456 |
| SNPs in Coding Regions | 345,210 | 338,990 |
The Scientist's Toolkit
Table 3: Essential Research Reagent Solutions for BSR-Seq
| Item | Function | Example Product/Kit |
|---|---|---|
| RNA Stabilization Solution | Immediately preserves RNA integrity in plant tissues at collection. | RNAlater Stabilization Solution |
| Plant Total RNA Kit | Isolates high-quality, DNA-free total RNA from complex plant tissues. | Qiagen RNeasy Plant Mini Kit |
| Stranded mRNA Library Prep Kit | Prepares Illumina-compatible, strand-specific RNA-seq libraries from poly-A RNA. | Illumina TruSeq Stranded mRNA LT Kit |
| HS DNA Assay Kit | Accurately quantifies low-concentration dsDNA libraries for sequencing pooling. | Qubit dsDNA HS Assay Kit |
| KASP Genotyping Mix | Enables high-throughput, low-cost SNP genotyping for marker validation. | LGC Biosearch Technologies KASP Assay Mix |
| SNP Calling Pipeline | A standardized software suite for identifying variants from aligned sequencing data. | GATK (Genome Analysis Toolkit) |
Workflow and Pathway Visualizations
This document provides application notes and protocols to support a thesis centered on utilizing Bulk Segregant RNA-Seq (BSR-Seq) for rapid identification of plant disease resistance (R) genes. The thesis posits that BSR-Seq integrates the genetic mapping power of bulk segregant analysis with the functional genomic insights of transcriptomics, offering a streamlined alternative to traditional map-based cloning. This integrated approach directly leverages the key advantages of speed, cost-effectiveness, and direct access to expression data to accelerate the discovery and functional characterization of novel R genes and their associated pathways.
Table 1: Comparative Analysis of Gene Identification Methods
| Method | Average Time to Candidate Gene(s) | Approximate Cost per Project (USD) | Key Output | Direct Expression Data? |
|---|---|---|---|---|
| Traditional Map-Based Cloning | 3-5 years | $50,000 - $100,000+ | Genetic interval (100s of genes) | No |
| MutMap/MutChromSeq | 1-2 years | $20,000 - $40,000 | Causal mutation in a genomic region | No |
| Association Genetics (GWAS) | 1-2 years (post-population) | $30,000 - $60,000 (seq.) | Linked markers & candidate genes | No |
| RNA-Seq (Differential Expression) | 6-12 months | $15,000 - $30,000 | Differentially expressed genes | Yes, but no mapping |
| BSR-Seq (Integrated Approach) | 4-9 months | $10,000 - $25,000 | Mapped interval + Expression data | Yes |
Table 2: Typical BSR-Seq Output Metrics (Example: Wheat Stripe Rust)
| Data Metric | Resistant Bulk (R) | Susceptible Bulk (S) | Analysis Outcome |
|---|---|---|---|
| Sequencing Depth (avg.) | 30 million reads | 30 million reads | Sufficient for SNP calling & expression |
| SNPs Identified (count) | ~2 million | ~2 million | Raw variation data |
| Δ(SNP-index) Peak | >0.8 at chromosome 2B | <0.2 at same locus | Maps candidate region to 2.5 Mb interval |
| DEGs in Mapped Region | 12 genes upregulated | Baseline expression | Narrows candidates to 12, including an NLR gene |
| Key Candidate Gene | NLR-TK2B.1 (Log2FC=5.8) | NLR-TK2B.1 (Low expr.) | High expression correlates with resistance |
Detailed Experimental Protocols
Protocol 1: Development of Segregating Population and Phenotyping for BSR-Seq
- Objective: To generate and characterize the plant material required for creating phenotypically distinct bulks.
- Materials: Resistant (R) and Susceptible (S) parental lines, growth chambers/field plots, pathogen inoculum, phenotyping tools.
- Procedure:
- Cross the R and S parents to generate an F1 generation.
- Self-pollinate F1 plants to produce an F2 segregating population (~200-500 individuals).
- Inoculate all F2 plants with the pathogen under controlled, reproducible conditions.
- Perform rigorous, quantitative phenotyping (e.g., disease scoring, lesion measurement, pathogen biomass qPCR) at the appropriate time post-inoculation.
- Based on phenotypic extremes, select 20-30 highly resistant and 20-30 highly susceptible individuals. Tissue samples (e.g., leaf tissue at early infection stage) from these plants are flash-frozen in liquid N₂ and stored at -80°C.
Protocol 2: Bulk Construction, RNA Extraction, and Library Preparation
- Objective: To create pooled RNA samples for sequencing that represent each phenotypic extreme.
- Materials: Liquid N₂, mortar and pestle, TRIzol reagent or plant-specific RNA kit, DNase I, Qubit fluorometer, Bioanalyzer, poly-A selection or rRNA depletion kit, strand-specific cDNA library prep kit.
- Procedure:
- Bulk Construction: Individually grind frozen tissue from each selected plant. Combine equal masses of powdered tissue from all resistant individuals to form the R-bulk. Repeat with susceptible individuals to form the S-bulk.
- RNA Extraction: Extract total RNA from each bulk using a validated method (e.g., TRIzol followed by column purification). Treat with DNase I.
- Quality Control: Assess RNA integrity (RIN > 7.0 on Bioanalyzer) and quantity.
- Library Prep: Perform poly-A enriched mRNA selection or ribosomal RNA depletion. Construct strand-specific, paired-end (150bp) cDNA libraries using a commercial high-throughput kit (e.g., Illumina TruSeq).
- Pooling & Sequencing: Quantify libraries by qPCR, pool at equimolar ratios, and sequence on an Illumina NovaSeq or HiSeq platform to a minimum depth of 20-30 million reads per bulk.
Protocol 3: Integrated BSR-Seq Data Analysis Pipeline
- Objective: To simultaneously identify the genomic region linked to the resistance trait and discover differentially expressed candidate genes within it.
- Materials: High-performance computing cluster, bioinformatics software.
- Procedure:
- Preprocessing: Trim adapters and low-quality bases with Trimmomatic. Assess quality with FastQC.
- Alignment & SNP Calling: Align clean reads to the reference genome using HISAT2 or STAR. Use SAMtools/BCFtools to call SNPs in each bulk.
- Genetic Mapping (SNP-index): Calculate the SNP-index (frequency of the resistant parent allele) for each SNP in both bulks. Compute Δ(SNP-index) = (SNP-indexR) - (SNP-indexS). Identify genomic regions where Δ(SNP-index) approaches 1 (significant peak).
- Expression Analysis: Calculate read counts per gene feature using featureCounts. Perform differential expression analysis (R-bulk vs. S-bulk) using DESeq2 or edgeR.
- Integration: Intersect the list of significantly differentially expressed genes (DEGs) (e.g., padj < 0.05, |Log2FC| > 2) with the genetically mapped region from Step 3. These genes are the high-priority candidates for functional validation.
Visualizations
Title: BSR-Seq Integrated Experimental & Analysis Workflow
Title: Synergy of BSR-Seq Key Advantages Leading to Gene Prioritization
The Scientist's Toolkit: Essential Research Reagent Solutions
Table 3: Key Reagents and Kits for BSR-Seq Implementation
| Item | Function in BSR-Seq Protocol | Example Product/Type |
|---|---|---|
| Plant RNA Preservation Solution | Stabilizes RNA immediately upon tissue sampling, preventing degradation prior to freezing. | RNAlater, RNAhold |
| High-Yield Plant RNA Kit | Extracts high-integrity total RNA from polysaccharide/polyphenol-rich plant tissues. | Norgen Plant RNA Kit, Zymo Quick-RNA Plant Kit |
| RNA Integrity Analyzer | Critical QC to ensure RNA is not degraded (RIN >7.0), a prerequisite for robust library prep. | Agilent Bioanalyzer (Plant RNA Nano) |
| rRNA Depletion Kit (Plant) | Removes abundant ribosomal RNA, enriching for mRNA, often more effective than poly-A selection in plants. | Illumina Ribo-Zero Plant, NuGEN AnyDeplete |
| Stranded mRNA Library Prep Kit | Constructs sequencing libraries that preserve strand-of-origin information, improving annotation. | Illumina TruSeq Stranded mRNA, NEBNext Ultra II |
| SNP Calling & Variant Analysis Suite | Software for accurate alignment, SNP identification, and genotype frequency calculation. | GATK, SAMtools/BCFtools, custom Python/R scripts |
| Differential Expression Software | Statistical analysis package to identify genes with significant expression changes between bulks. | DESeq2 (R), edgeR (R) |
Within the broader thesis on Bulked Segregant Analysis RNA-Seq (BSR-Seq) for plant disease resistance gene identification, three foundational prerequisites are critical for success. BSR-Seq integrates phenotypic assessment of segregating populations with high-throughput RNA sequencing to rapidly pinpoint causal genetic loci. The efficacy of this approach is fundamentally contingent upon: 1) the design and development of a suitable genetic population, 2) the accuracy and precision of disease phenotyping, and 3) the adequacy of sequencing depth to detect allele frequency shifts. This document outlines detailed application notes and protocols to optimize these prerequisites, ensuring robust and reproducible identification of resistance genes.
Prerequisite 1: Population Development
A well-structured segregating population is the cornerstone of BSR-Seq. The population must exhibit clear segregation for the resistance trait and possess sufficient recombination events for fine-mapping.
Population Types and Selection Criteria
The choice of population depends on the research goals, available time, and genetic complexity of the trait.
Table 1: Comparison of Population Types for BSR-Seq
| Population Type | Generation Time | Genetic Resolution | Ideal Use Case | Key Consideration for BSR-Seq |
|---|---|---|---|---|
| F₂ | Short (1-2 seasons) | Low (10-20 cM) | Initial major QTL/gene discovery | Large population size (>200) required; heterozygosity complicates bulk construction. |
| Recombinant Inbred Lines (RILs) | Long (6-8+ generations) | High (<5 cM) | High-resolution mapping of stable traits | Immortal resource; fixed homozygous lines allow replicate phenotyping and RNA pooling from multiple plants. |
| Near-Isogenic Lines (NILs) | Variable | Very High (<1 cM) | Validation and fine-mapping of a specific region | Minimal genetic background noise; ideal for creating contrasting bulks with extreme phenotypes. |
| Mutagenized Population (e.g., EMS) | Moderate | Single nucleotide | Forward genetics, novel allele discovery | Requires extensive phenotyping to identify mutants; bulk construction from multiple independent mutants. |
Protocol: Development of an F₂ Population for BSR-Seq
- Objective: To generate a segregating population from a cross between resistant (R) and susceptible (S) parental lines.
- Materials: Parental seeds (R and S), growth facilities, plant tags, pollination tools.
- Procedure:
- Parental Growth: Grow parental lines under controlled conditions to ensure health and synchronize flowering.
- Cross-Hybridization (Season 1): Emasculate flowers of the female parent (e.g., R) and pollinate with pollen from the male parent (S). Label crosses. Harvest F₁ seeds.
- F₁ Generation (Season 2): Plant F₁ seeds. Confirm hybridity using a few molecular markers. Allow self-pollination to produce F₂ seeds. Bulk harvest F₁ plants to create a pooled F₂ seed stock.
- F₂ Population Expansion (Season 3): Plant the F₂ population (minimum 200-500 individuals) in a randomized design. This population will be used for phenotyping and bulk construction.
Prerequisite 2: Phenotyping Accuracy
Precise and quantitative disease assessment is essential to correctly classify individuals for bulk construction. Inaccurate phenotyping directly leads to false associations.
Phenotyping Methods and Metrics
Table 2: Quantitative Phenotyping Methods for Disease Resistance
| Method | Measurement | Equipment/Tool | Advantage for BSR-Seq |
|---|---|---|---|
| Disease Index (DI) | Ordinal scale (e.g., 0-5) based on lesion size/coverage | Standardized rating charts | Fast, allows high-throughput scoring of large populations. |
| Area Under Disease Progress Curve (AUDPC) | Quantitative integration of disease severity over time | Repeated DI assessments, calculation software | Captures dynamic resistance components (e.g., rate-reducing resistance). |
| Digital Image Analysis | Percentage of diseased leaf area | Camera, software (e.g., ImageJ, PlantCV) | High objectivity, generates continuous data for precise bulk selection. |
| Pathogen Biomass Quantification | Relative pathogen DNA/RNA level | qPCR with pathogen-specific primers | Highly quantitative, measures resistance at the pathogen level. |
Protocol: High-Throughput Phenotyping for BSR-Seq Bulk Construction
- Objective: To accurately score disease severity in an F₂ population and select extreme phenotypes for RNA bulking.
- Materials: Inoculum, inoculation tools, growth chamber/greenhouse, rating chart, data sheets, leaf sample collection kits (RNAlater, tubes, labels).
- Procedure:
- Inoculation: At the appropriate growth stage, inoculate all F₂ plants uniformly using a standardized method (e.g., spray, point inoculation). Include R and S parents as controls.
- Incubation: Maintain conditions (humidity, temperature) conducive to disease development.
- Scoring: At the peak disease contrast (determined empirically), score each plant using a Disease Index (e.g., 0=no symptoms, 5=fully necrotic/chlorotic). Perform scoring blind if possible. Consider dual scoring by independent raters.
- Selection for Bulks: Rank all F₂ plants by DI score. Select the ~10-20% most resistant (e.g., DI 0-1) to form the "Resistant Bulk" (R-bulk). Select the ~10-20% most susceptible (e.g., DI 4-5) to form the "Susceptible Bulk" (S-bulk). Immediately collect and flash-freeze leaf tissue from each selected plant in liquid N₂, storing at -80°C. Pool equal amounts of tissue (or RNA) from each plant within a bulk.
Prerequisite 3: Sequencing Depth
Adequate sequencing depth is required to detect statistically significant differences in allele frequencies between the R-bulk and S-bulk at loci linked to the resistance gene.
Depth Calculation and Considerations
Depth requirements depend on population size, bulk size, and expected allele frequency difference.
Table 3: Guidelines for Sequencing Depth in BSR-Seq
| Factor | Impact on Required Depth | Recommendation |
|---|---|---|
| Bulk Size | Smaller bulks (<20 individuals) show larger allele frequency shifts, requiring less depth. | 20-30 individuals per bulk is optimal. |
| Population Size | Larger base populations (F₂ > 500) provide more recombination, requiring finer detection. | Increase depth for higher mapping resolution. |
| Genome Size & Complexity | Larger, repetitive genomes require more reads for sufficient transcript coverage. | Adjust depth based on effective (non-repetitive) genome size. |
| Expected Frequency Difference | For a major gene in an F₂, the frequency difference (ΔAF) can approach 0.5. | For ΔAF ~0.3-0.5, 20-30M reads per bulk may suffice. For polygenic traits (ΔAF <0.1), >50M reads may be needed. |
Protocol: RNA Extraction, Library Prep, and Sequencing Planning
- Objective: To prepare sequencing-ready RNA libraries from R and S bulks with quality control at each step.
- Materials: Frozen tissue, mortar/pestle, TRIzol or column-based RNA kit, DNase I, bioanalyzer/tape station, rRNA depletion kit, strand-specific library prep kit, sequencer.
- Procedure:
- RNA Extraction: Homogenize pooled tissue under liquid N₂. Extract total RNA using a method that preserves integrity (e.g., TRIzol followed by column cleanup). Treat with DNase I.
- QC: Assess RNA concentration (Qubit) and integrity (RIN > 7.0 on Bioanalyzer).
- rRNA Depletion: Perform ribosomal RNA depletion to enrich for mRNA and non-coding RNAs. Do not use poly-A selection if studying non-polyadenylated transcripts or bacterial RNA.
- Library Preparation: Construct strand-specific cDNA libraries using a validated kit (e.g., Illumina TruSeq Stranded Total RNA). Include unique dual indices for multiplexing.
- Sequencing: Pool libraries and sequence on an Illumina NovaSeq or HiSeq platform. Target Depth: Aim for a minimum of 30 million paired-end (2x150 bp) reads per bulk. Sequence both bulks in the same lane to minimize batch effects.
The Scientist's Toolkit: Research Reagent Solutions
Table 4: Essential Materials for BSR-Seq Workflow
| Item | Function in BSR-Seq | Example Product/Supplier |
|---|---|---|
| RNAlater Stabilization Solution | Preserves RNA integrity in field-collected or immediately post-phenotyping tissue samples. | Thermo Fisher Scientific RNAlater |
| High Integrity RNA Extraction Kit | Ishes high-quality, genomic DNA-free total RNA suitable for RNA-Seq library construction. | Zymo Research Quick-RNA Plant Kit; Qiagen RNeasy Plant Mini Kit |
| Ribosomal RNA Depletion Kit | Enriches for non-ribosomal transcripts (crucial for plants, pathogens). | Illumina Ribo-Zero Plus rRNA Depletion Kit; NuGEN AnyDeplete |
| Stranded RNA Library Prep Kit | Prepares sequencing libraries that retain strand-of-origin information for accurate expression and variant analysis. | Illumina TruSeq Stranded Total RNA; NEBNext Ultra II Directional RNA Library Prep |
| DNA/RNA Integrity Number (DIN/RIN) Analysis Kit | Provides objective quality control of nucleic acid integrity prior to costly library prep. | Agilent RNA 6000 Nano Kit (for Bioanalyzer) |
| Plant-Pathogen Specific qPCR Assays | Quantifies pathogen biomass for precise phenotyping and confirms infection in bulks. | Custom TaqMan or SYBR Green assays targeting pathogen effector genes. |
| High-Fidelity DNA Polymerase | Validates SNPs identified from BSR-Seq data via PCR and Sanger sequencing. | NEB Q5 High-Fidelity DNA Polymerase |
Visualizations
From Theory to Bench: A Step-by-Step BSR-Seq Protocol for Resistance Gene Identification
Within the context of a thesis on Bulked Segregant Analysis RNA-Seq (BSR-Seq) for plant disease resistance gene identification, the development and precise phenotyping of a segregating population is the foundational step. This stage generates the biological material and phenotypic data essential for linking genotype to phenotype. The choice of population type—F2, Recombinant Inbred Lines (RILs), or Near-Isogenic Lines (NILs)—depends on the research goals, timeline, and desired genetic resolution.
Table 1: Comparison of Segregating Population Types for Disease Resistance Mapping
| Feature | F2 Population | Recombinant Inbred Lines (RILs) | Near-Isogenic Lines (NILs) |
|---|---|---|---|
| Development | Single generation (F1 selfing). | Repeated selfing/sib-mating for 6+ generations to achieve homozygosity. | Backcrossing (6+ cycles) to recurrent parent, followed by selfing. |
| Genetic State | Segregating; individuals are heterozygous at many loci. | Homozygous and immortal; fixed genotypes. | Mostly isogenic to recurrent parent except for introgressed donor segment. |
| Time to Develop | Short (1-2 seasons). | Long (5-8 generations). | Long (5-8 generations). |
| Mapping Power | Moderate. Suitable for initial detection of major QTLs. | High. Permanent population allows replication, increasing QTL detection power. | Very High for fine-mapping. Isolates a specific target region. |
| Replication | Not replicable (unique individuals). | Fully replicable across time/locations. | Fully replicable. |
| Primary Use in BSR-Seq | Initial, rapid bulked segregant analysis. | High-resolution QTL mapping; creation of stable trait bulks. | Fine-mapping and functional validation of candidate genes. |
| Phenotyping Effort | Must be done in a single experiment. | Can be phenotyped repeatedly over trials. | Can be phenotyped repeatedly; clean background reduces noise. |
Detailed Protocols
Protocol 1: Development of an F2 Population for Rapid BSR-Seq
Objective: To create a segregating population for initial, broad-scale mapping of a major disease resistance locus.
Materials:
- Parental Line 1 (Resistant donor).
- Parental Line 2 (Susceptible recipient).
- Standard plant growth facilities.
Method:
- Crossing: Perform a controlled cross between Parent 1 () and Parent 2 () to generate F1 hybrid seeds.
- F1 Generation: Grow F1 plants under controlled conditions. Verify hybridity using a few polymorphic molecular markers. Self-pollinate all confirmed F1 plants to produce F2 seeds.
- F2 Population Growth: Sow a population of 200-500 F2 seeds. The size depends on the expected segregation ratio and desired statistical power.
- Phenotyping & Bulk Construction (for BSR-Seq): Subject F2 plants to standardized disease assay (see Protocol 4). Based on extreme phenotypes, create two pools:
- Resistant Bulk (R-bulk): Composite tissue from ~20-30 most resistant plants.
- Susceptible Bulk (S-bulk): Composite tissue from ~20-30 most susceptible plants.
- Progeny Advancement: Reserve remaining leaf tissue from each individual F2 plant for DNA/RNA extraction and potential development into RILs or NILs.
Protocol 2: Development of Recombinant Inbred Lines (RILs) via Single Seed Descent (SSD)
Objective: To create an immortal, homozygous mapping population for high-resolution, replicated QTL analysis.
Materials:
- F2 seeds from a cross.
- Facilities for sequential plant generations.
Method:
- Founder F2s: Select 200-300 random individual plants from the F2 population.
- Inbreeding by SSD:
- For each F2 plant, harvest one seed to represent the next generation (F3).
- Grow the F3 plant, and again harvest a single seed to advance to F4.
- Continue this process for a minimum of 6-8 generations (to F~7~ or F~8~). This drives loci toward homozygosity.
- Stabilization & Seed Increase: At the F~7~/F~8~ generation, self each line and increase seed under controlled conditions to create a stock for each unique RIL.
- Phenotyping: Replicate each RIL (e.g., 3-5 biological replicates) in a randomized experimental design. Subject to disease phenotyping. Phenotypic data is now based on line means, increasing accuracy.
Protocol 3: Development of Near-Isogenic Lines (NILs) via Marker-Assisted Backcrossing
Objective: To introgress a specific disease resistance QTL from a donor into a uniform genetic background for fine-mapping and validation.
Materials:
- Donor parent (Resistant).
- Recurrent parent (Susceptible, elite background).
- Polymorphic markers flanking the target QTL region and markers covering the rest of the genome.
Method:
- Initial Cross: Cross Donor () x Recurrent Parent (RP) () to create F1.
- Backcrossing Cycles (BC):
- BC1: Cross F1 () x RP (). Screen progeny with flanking markers to select individuals heterozygous at the target locus. Use background markers to select individuals with highest proportion of RP genome.
- BC2-BC5: Repeat backcrossing to RP, each time selecting BCnF1 plants that are heterozygous at the target locus but have the maximal recovery of the RP background (Marker-Assisted Selection).
- Selfing & Line Fixation: After BC~5~ or BC~6~, self a selected plant heterozygous at the target locus. In the resulting BC~5~F~2~ or BC~6~F~2~ population, identify plants homozygous for the donor allele at the target region. These are your preliminary NILs.
- Validation & Fine-Mapping: Confirm that the NIL pair (NIL[R] and NIL[S]) differ only at the introgressed segment and show the expected phenotypic difference. Use progeny from a cross between these NILs to fine-map the resistance gene.
Protocol 4: Standardized Disease Phenotyping for Bulk Construction
Objective: To generate reproducible, quantitative phenotypic data for segregating individuals to define extreme bulks for BSR-Seq.
Materials:
- Pathogen inoculum (spores, bacterial culture, viral preparation).
- Controlled environment growth chamber or greenhouse.
- Disease rating scale (e.g., 0-9 scale, lesion size, % leaf area affected).
Method:
- Experimental Design: Grow plants in a randomized complete block design. Include resistant and susceptible parent checks every 20-30 plants.
- Inoculation: At the appropriate plant growth stage, apply pathogen inoculum uniformly using a standardized method (e.g., spray inoculation, point inoculation, vector release).
- Post-Inoculation Conditions: Maintain controlled environmental conditions (temperature, humidity, light) conducive to disease development.
- Phenotyping & Scoring: After a defined incubation period, assess disease symptoms. Use a predefined quantitative or semi-quantitative scale. For digital phenotyping, capture images and use software (e.g., ImageJ, PlantCV) to calculate disease area.
- Bulk Selection: Rank all individuals by disease score. Select the top and bottom 10-15% of individuals to constitute the susceptible and resistant bulks, respectively. Harvest and pool equal amounts of leaf tissue from each plant in a bulk for RNA extraction.
Diagrams
The Scientist's Toolkit: Research Reagent Solutions
Table 2: Essential Materials for Population Development and Phenotyping
| Item | Function & Relevance |
|---|---|
| Polymorphic Molecular Markers (SSR, SNP) | For verifying hybridity (F1), monitoring recurrent parent genome recovery during backcrossing (NIL development), and genotyping. Essential for Marker-Assisted Selection (MAS). |
| Controlled Environment Chambers | Provide uniform conditions for plant growth and disease development, ensuring reproducible phenotyping critical for accurate bulk selection. |
| Pathogen-Specific Growth Media | For mass production of standardized, virulent inoculum for phenotyping assays. |
| Digital Phenotyping System (Camera, Software like PlantCV) | Enables high-throughput, objective quantification of disease symptoms (lesion count, area, color) for precise ranking of individuals. |
| RNA Stabilization Solution (e.g., RNAlater) | Preserves the transcriptional state at the point of sampling immediately after phenotyping. Crucial for capturing gene expression profiles relevant to the resistant/susceptible state for BSR-Seq. |
| Tissue Lyser/Homogenizer | Ensures efficient, simultaneous disruption of multiple tissue samples for consistent RNA/DNA extraction from composite bulks. |
| High-Fidelity DNA Polymerase | For accurate amplification of marker sequences during high-throughput genotyping in population development. |
| Hydroponic/Aseptic Growth Systems | Allow for precise control of nutrient and pathogen exposure, useful for phenotyping soil-borne diseases or for sterile tissue collection for RNA. |
Within a BSR-Seq (Bulk Segregant RNA-Seq) pipeline for plant disease resistance gene identification, the construction of phenotypically and genetically distinct bulks is the critical step that determines the signal-to-noise ratio and ultimate success of the project. This protocol details the strategies for selecting and constructing resistant (R) and susceptible (S) pools from a segregating population, ensuring robust differential expression analysis and accurate candidate gene localization.
Core Principles of Bulk Construction
The foundational principle is to create two pools that are genetically identical across the genome except for the region harboring the resistance gene(s) of interest. Phenotypic extremes are combined to "average out" genetic background noise and enrich for allele frequency differences at the causal locus.
Key Quantitative Parameters for Bulk Selection:
| Parameter | Ideal Target | Rationale | Common Range |
|---|---|---|---|
| Population Size (F2, BC, etc.) | 200 - 500 individuals | Ensures sufficient phenotypic extremes and Mendelian segregation. | 150 - 1000 |
| Bulk Size (per pool) | 20 - 30 individuals | Balances allele enrichment and cost. Too small increases sampling error; too large dilutes signal. | 15 - 40 |
| Phenotyping Confidence | >95% accuracy | Misclassified individuals drastically reduce bulk contrast. | N/A |
| Expected Allele Frequency Difference (ΔAF) at QTL) | R Bulk: >0.8, S Bulk: <0.2 | Maximizes statistical power for association. | ΔAF ≥ 0.6 |
| Pooled Sequencing Depth (per bulk) | 30-50x (per individual equivalent) | Adequate for reliable SNP frequency estimation. | 20-100x |
Detailed Experimental Protocol
Population Development and Phenotyping
- Crossing: Develop a segregating population (e.g., F2, BC1F1, RILs) from a cross between a homozygous resistant parent (RR) and a homozygous susceptible parent (rr).
- Pathogen Inoculation: Subject all individuals to standardized, high-pressure disease assays. Conditions (inoculum concentration, growth stage, environment) must be uniformly controlled.
- Quantitative Phenotyping: Score disease response at the peak symptom period using a reproducible scale (e.g., 1-9 disease index, lesion size, pathogen biomass via qPCR). Record data for each individual.
Statistical Selection of Bulk Constituents
- Rank Phenotypes: Order all individuals from the population based on phenotypic scores.
- Define Cut-offs: Select the 10-15% most resistant and 10-15% most susceptible individuals. Avoid intermediate phenotypes.
- Verify Extremes: Re-examine selected plants for phenotype consistency. If possible, use a second, independent phenotyping method for confirmation (e.g., molecular assay for pathogen load).
- Record and Label: Create a definitive list of plant IDs for the R-bulk and S-bulk.
Tissue Sampling and RNA Pooling
- Tissue Harvest: Collect identical tissue (e.g., inoculated leaf sections) from each selected individual at a predefined, biologically relevant time point post-inoculation (e.g., early during defense response).
- Individual RNA Extraction: Extract high-quality total RNA from each plant individually using a validated kit (e.g., TRIzol/column-based). Include DNase treatment. Quantify using fluorometry (e.g., Qubit).
- Quality Control: Assess RNA Integrity Number (RIN) for each sample via bioanalyzer. Only pool samples with RIN > 8.0.
- Equimolar Pooling: Precisely measure RNA concentration. Combine equal molar amounts of RNA from each individual within a phenotypic class to create the R-bulk and S-bulk pools.
- Final QC: Re-qualify and quantify the final pooled RNA samples before library preparation.
Alternative Strategies & Considerations
| Strategy | Description | Best For | Diagram Reference |
|---|---|---|---|
| Extreme Phenotype (Standard) | Selection of clear phenotypic extremes as described. | Major effect genes, clear binary traits. | Fig 1 |
| Selective Genotyping | Phenotype large population, then genotype extremes with few markers to confirm allelic difference at target region before bulking. | When phenotyping is costly or has some error. | Fig 2 |
| Tail Pool Size Optimization | Empirical testing of different bulk sizes (e.g., 5%, 10%, 20% tails) on a subset to maximize ΔAF. | Novel populations with unknown genetic architecture. | N/A |
| Multi-Bulk/Stepwise | Construct more than two bulks (e.g., R1, R2, S1, S2) with varying severity to refine QTL location. | Complex or quantitative resistance traits. | N/A |
The Scientist's Toolkit: Essential Research Reagents & Materials
| Item | Function/Description | Example Product/Kit |
|---|---|---|
| RNA Extraction Kit | High-yield, high-integrity total RNA isolation from plant tissue, often with polysaccharide/polyphenol removal. | Norgen Plant RNA Isolation Kit, Qiagen RNeasy Plant Mini Kit. |
| DNase I, RNase-free | Removal of genomic DNA contamination from RNA preps. | Thermo Scientific DNase I (RNase-free). |
| RNA Integrity Assessor | Microfluidics-based system for quantifying RNA quality (RIN). | Agilent Bioanalyzer 2100 with RNA Nano Kit. |
| Fluorometric RNA Quantifier | Accurate, dye-based quantification of RNA concentration. | Invitrogen Qubit RNA HS Assay. |
| Stranded mRNA-Seq Kit | Library preparation from pooled RNA, capturing strand information. | Illumina Stranded mRNA Prep, NEBnext Ultra II Directional RNA. |
| High-Fidelity DNA Polymerase | For PCR during library amplification and potential marker validation. | KAPA HiFi HotStart ReadyMix. |
| PCR Purification & Size Selection | Cleanup of library constructs and removal of adapter dimers. | SPRIselect beads (Beckman Coulter). |
Visualized Workflows and Strategies
Within a thesis employing Bulk Segregant RNA-Seq (BSR-Seq) for plant disease resistance (R) gene identification, Step 3 is the pivotal wet-lab and sequencing phase. It transforms biological samples—contrasting pools of resistant (R-pool) and susceptible (S-pool) plant tissues post-inoculation—into quantitative, sequence-ready libraries. The integrity of this step directly dictates the resolution for pinpointing candidate R genes and associated pathways.
RNA Extraction Protocol from Infected Plant Tissue
Objective: To isolate high-integrity, genomic DNA-free total RNA from pathogen-inoculated leaf samples for downstream transcriptomic analysis.
Key Considerations:
- RNase Decontamination: Treat all surfaces and equipment with RNase decontamination solution.
- Inhibition of Host and Pathogen RNases: Use a lysis buffer containing potent denaturants (e.g., guanidine thiocyanate).
- Polysaccharide/Polyphenol Removal: Critical for many plant species; protocols must include specific precipitation or column-wash steps.
Detailed Protocol (Based on Modified TRIzol/Column Hybrid Method):
- Homogenization: Flash-freeze 100 mg of leaf tissue in liquid N₂. Grind to a fine powder using a mortar and pestle. Transfer powder to a tube containing 1 mL of pre-chilled TRIzol or equivalent reagent.
- Phase Separation: Incubate 5 min at RT. Add 0.2 mL chloroform, shake vigorously for 15 sec, incubate 2-3 min. Centrifuge at 12,000 × g for 15 min at 4°C.
- RNA Precipitation: Transfer the upper aqueous phase to a new tube. Precipitate RNA by adding 0.5 mL isopropanol. Incubate 10 min at RT, then centrifuge at 12,000 × g for 10 min at 4°C.
- Wash: Remove supernatant. Wash pellet with 1 mL 75% ethanol (in DEPC-treated water). Centrifuge at 7,500 × g for 5 min at 4°C. Air-dry pellet briefly.
- DNase Treatment & Column Purification: Redissolve RNA pellet in 50 µL nuclease-free water. Add 10 µL 10× DNase I buffer and 5 µL RNase-free DNase I (1 U/µL). Incubate at 37°C for 30 min. Purify using a silica membrane-based column (e.g., RNeasy MinElute Cleanup Kit). Elute in 30 µL RNase-free water.
- Quality Control: Assess RNA integrity (RIN ≥ 8.0) using an Agilent Bioanalyzer RNA Nano chip and quantify via Qubit RNA HS Assay.
Table 1: RNA Quality Control Metrics for BSR-Seq Pools
| Sample Pool | Total RNA Yield (µg) | 260/280 Ratio | 260/230 Ratio | RIN (RNA Integrity Number) | QC Status |
|---|---|---|---|---|---|
| Resistant (R) Pool | 45.2 | 2.10 | 2.05 | 8.7 | Pass |
| Susceptible (S) Pool | 38.7 | 2.08 | 1.95 | 8.2 | Pass |
| Acceptance Threshold | > 10 µg | 1.8 - 2.2 | > 1.8 | ≥ 8.0 |
Strand-Specific RNA-Seq Library Preparation
Objective: To convert high-quality total RNA into indexed, sequencing-ready cDNA libraries that preserve strand-of-origin information.
Detailed Protocol (Based on Illumina Stranded mRNA Prep):
- Poly-A Selection: Use magnetic oligo-dT beads to enrich for polyadenylated mRNA from 1 µg total RNA.
- Fragmentation & Elution: Elute mRNA from beads and fragment via divalent cation buffer at 94°C for 8 minutes to a target size of ~300 bp.
- First-Strand cDNA Synthesis: Use random hexamer primers and reverse transcriptase. Incorporate dUTP in place of dTTP in the Second-Strand Synthesis mix.
- Second-Strand Synthesis: Generate double-stranded cDNA. The dUTP incorporation marks the second strand.
- End Repair, A-tailing, and Adapter Ligation: Create blunt ends, add a single 'A' nucleotide, and ligate indexed, unique dual (UDI) adapters.
- Uracil Digestion: Treat with USER enzyme to selectively digest the dUTP-marked second strand, ensuring strand specificity.
- Library Amplification: Perform 12 cycles of PCR to enrich for adapter-ligated fragments. Clean up with magnetic beads.
- Final QC: Assess library size distribution (~350-450 bp) on a Bioanalyzer High Sensitivity DNA chip and quantify via qPCR (KAPA Library Quantification Kit).
Table 2: Key Parameters for Library Preparation and Sequencing
| Parameter | Specification | Rationale for BSR-Seq |
|---|---|---|
| Input RNA | 500 ng - 1 µg, RIN > 8.0 | Ensures sufficient complexity & representation |
| Library Type | Stranded, paired-end (PE) | Allows sense/antisense differentiation & better mapping |
| Read Length | 150 bp PE | Optimal for plant transcriptome alignment & SNP calling |
| Sequencing Depth | 40-50 million reads per pool | Provides statistical power for allele frequency detection |
| Indexing | Unique Dual Indexes (UDIs) | Enables error-corrected sample multiplexing & prevents index hopping |
High-Throughput Sequencing & Primary Data Output
Objective: To generate raw sequencing data (FASTQ files) for both bulks with high accuracy and balanced representation.
Standardized Sequencing Protocol (Illumina NovaSeq 6000):
- Pool Normalization: Quantify final libraries by qPCR. Combine libraries (R- and S-pool) in equimolar ratios to form a sequencing pool.
- Denaturation & Dilution: Denature the pool with NaOH, dilute to final loading concentration (e.g., 200 pM) in hybridization buffer.
- Sequencing Run: Load onto an S4 flow cell. Run with the following cycle recipe: Read1: 150 cycles, Index1: 10 cycles, Index2: 10 cycles, Read2: 150 cycles.
- Primary Analysis: The sequencer's onboard software (e.g., Illumina DRAGEN) performs base calling and demultiplexing by UDIs, generating paired-end FASTQ files for each pool.
The Scientist's Toolkit: Research Reagent Solutions
| Item | Function in BSR-Seq Step 3 |
|---|---|
| TRIzol/QIAzol | Monophasic lysis reagent for simultaneous disruption, inhibition of RNases, and maintenance of RNA integrity. |
| RNase-free DNase I | Eliminates genomic DNA contamination, crucial for accurate transcript quantification. |
| RNeasy/MinElute Kits | Silica-membrane columns for clean-up and concentration of RNA/cDNA, removing salts, enzymes, and inhibitors. |
| Agilent Bioanalyzer RNA Nano Chip | Microfluidics-based system for automated assessment of RNA integrity (RIN). |
| Poly(A) Magnetic Beads | Enriches for mRNA by selectively binding polyadenylated tails, removing rRNA. |
| Stranded mRNA Prep Kit | All-in-one kit for constructing strand-specific libraries with dUTP second-strand marking. |
| Unique Dual Index (UDI) Adapters | Molecular barcodes for multiplexing; UDIs correct for index-switching errors. |
| KAPA Library Quantification Kit | qPCR-based assay for accurate, fragment-size-aware measurement of amplifiable library concentration. |
| NovaSeq 6000 S4 Reagent Kit | Provides chemistry (polymerase, nucleotides, buffers) for massive parallel sequencing. |
Visualization: BSR-Seq Step 3 Workflow
Diagram Title: RNA to FASTQ: BSR-Seq Laboratory Workflow
Visualization: Key Library Construction Chemistry
Diagram Title: dUTP-Based Stranded Library Construction
Application Notes
Within a thesis utilizing Bulk Segregant RNA-Seq (BSR-Seq) for plant disease resistance (R) gene identification, Step 4 is the computational core that transforms raw sequencing reads into candidate genomic intervals. This pipeline is designed to handle pooled, segregating populations, where the goal is to identify genomic regions where the allelic frequencies differ significantly between resistant (R-bulk) and susceptible (S-bulk) pools.
Key Challenges & Solutions:
- Pooled Data: Standard variant callers assume diploid individuals. The pipeline must estimate allele frequencies from sequence read counts within each bulk.
- Background Noise: Genetic differences unrelated to the trait (population structure, sequencing errors) must be distinguished from true signal.
- Precision Mapping: For R-genes often residing in complex, repetitive regions, accurate alignment and variant detection are critical.
The integration of SNP/InDel calling with Euclidean Distance (ED) and ΔSNP analysis provides a robust, multi-faceted approach to pinpoint candidate loci.
Detailed Experimental Protocols
Protocol 1: Read Alignment to a Reference Genome
Objective: Map high-quality filtered reads from R- and S-bulks to a reference genome.
Materials: Compute server (≥16 cores, ≥64 GB RAM), Linux/Unix environment, sequencing reads (R1.fastq, R2.fastq for each bulk), reference genome (FASTA), gene annotation file (GTF/GFF).
Methodology:
- Genome Indexing: Create a search index for the reference genome.
Read Alignment: Map paired-end reads using a splice-aware aligner (e.g., HISAT2 for plants).
SAM to BAM Conversion & Sorting: Convert sequence alignment map (SAM) to binary (BAM) format and sort by genomic coordinate.
Protocol 2: SNP and InDel Calling for Bulk Data
Objective: Identify single nucleotide polymorphisms and insertions/deletions in each bulk and calculate their allele frequencies.
Materials: Sorted BAM files, reference genome, high-performance computing cluster recommended.
Methodology:
- Variant Calling with BCFtools (mpileup): Generates a VCF file with genotype likelihoods for all positions.
Variant Filtering: Filter based on depth, quality, and allele frequency.
Extract Bulk Allele Frequencies: Use a custom script (e.g., Python with PyVCF) to parse the VCF. For each bulk at each variant position, calculate the alternative allele frequency (AF) as:
AF = (Alt Read Count) / (Total Read Count at that position).
Protocol 3: ED and ΔSNP Analysis for Candidate Region Identification
Objective: Calculate Euclidean Distance (ED) and ΔSNP scores to identify genomic regions with the greatest divergence in allele frequency between bulks.
Materials: Table of variant positions with chromosome, position, AF in R-bulk (AFR), and AF in S-bulk (AFS).
Methodology:
- Data Preparation: Create a tab-delimited file:
Chr\tPos\tAF_R\tAF_S. - Sliding Window Calculation: Use a custom R or Python script.
- Define a window size (e.g., 1 Mb) and step size (e.g., 100 kb).
- For each window, calculate:
- Euclidean Distance (ED):
ED = sqrt( Σ (AF_R - AF_S)² / n ), where n is the number of SNPs in the window. High ED indicates a region of large, consistent allelic divergence. - ΔSNP (Delta SNP):
ΔSNP = (SNPs with |AF_R - AF_S| > threshold) / (Total SNPs in window). Commonly used threshold is 0.8. High ΔSNP indicates a high proportion of fixed or near-fixed differences.
- Euclidean Distance (ED):
- Peak Identification: Plot ED and ΔSNP values across the genome. Candidate regions are defined by overlapping peaks in both analyses, significantly above the genomic background (e.g., top 1% of values).
Data Presentation
Table 1: Summary of Key Variant Metrics from a BSR-Seq Study on Wheat Stripe Rust Resistance
| Metric | Resistant Bulk (R) | Susceptible Bulk (S) | Notes | ||
|---|---|---|---|---|---|
| Total SNPs Called | 1,245,678 | 1,250,432 | After quality filtering (QUAL>30, DP>20) | ||
| Average SNP Depth | 48x | 52x | Ensures reliable allele frequency estimation | ||
| High-Effect SNPs | 12,540 | 12,801 | Missense, nonsense, splice-site variants | ||
| Candidate Region SNPs | 287 | 15 | Within the primary ED/ΔSNP peak on Chr2B | ||
| Avg. ΔAF in Peak | 0.91 | 0.12 | Average allele frequency difference ( | AFR - AFS | ) |
Table 2: Top Candidate Windows from ED/ΔSNP Analysis
| Chromosome | Window Start-End | ED Value (Rank) | ΔSNP Value (Rank) | Known R-Gene Homologs in Interval |
|---|---|---|---|---|
| 2B | 105,200,001 - 106,200,000 | 0.89 (1) | 0.78 (1) | NLR family genes, LRR kinase |
| 5A | 32,500,001 - 33,500,000 | 0.45 (15) | 0.32 (22) | Receptor-like protein (RLP) |
| 7D | 18,100,001 - 19,100,000 | 0.51 (8) | 0.41 (12) | None |
Mandatory Visualization
BSR-Seq Bioinformatics Pipeline Workflow
ED and ΔSNP Score Calculation Logic
The Scientist's Toolkit: Research Reagent Solutions
| Item | Function in BSR-Seq Bioinformatics |
|---|---|
| High-Quality Reference Genome | A chromosome-level, well-annotated assembly is essential for accurate read alignment and positional mapping of candidate intervals. |
| Splice-Aware Aligner (HISAT2, STAR) | RNA-Seq reads span exon junctions; these tools use genome transcriptome indices to accurately map spliced reads. |
| Variant Caller (BCFtools, GATK) | Specialized software to identify genetic variants (SNPs/InDels) from sequence alignment data, providing genotype likelihoods. |
| VCF File | The standard Variant Call Format file storing position, reference/alternate alleles, quality, and sample genotype information. |
| R/Python with Bioinformatic Libraries | For custom scripting of allele frequency parsing, sliding window analyses (ED, ΔSNP), and visualization (ggplot2, matplotlib). |
| High-Performance Computing (HPC) Cluster | Alignment and variant calling are computationally intensive; an HPC enables parallel processing and managing large BAM/VCF files. |
Application Notes
Following Bulk Segregant RNA-Seq (BSR-Seq), which identifies a genomic region linked to a disease resistance phenotype, Step 5 focuses on refining this region and selecting the most probable causal gene(s). This step integrates the BSR-Seq SNP frequency data with transcriptomic expression profiles from resistant (R) and susceptible (S) pools post-pathogen challenge. The core principle is that the true resistance gene is likely within the candidate region and shows differential expression (DE) in response to the pathogen.
The process involves two main phases:
- Candidate Region Identification: Using the Δ(SNP-index) plot from BSR-Seq, a statistically significant peak (e.g., above a 99% confidence interval) defines the candidate interval. This region is typically several megabases and contains dozens to hundreds of annotated genes.
- Gene Prioritization: RNA-Seq-derived expression data (e.g., FPKM, TPM counts) from the R and S pools are compared. Genes within the candidate region are filtered and ranked based on the significance (p-value, q-value) and magnitude (log2FoldChange) of their differential expression. The highest-priority candidates are those with significant up-regulation in the R pool, consistent with an active defense response.
Key Quantitative Metrics for Prioritization:
| Metric | Description | Typical Priority Threshold | ||
|---|---|---|---|---|
| Genomic Position | Must be within the BSR-Seq peak region (e.g., Chr02:15.4Mb - 18.1Mb). | Mandatory filter | ||
| log2FoldChange (R/S) | Magnitude of expression difference. | > | 1 | (Often >2 for high priority) |
| Adjusted p-value (q-value) | Statistical significance of DE, corrected for multiple testing. | < 0.01 or < 0.05 | ||
| Base Mean Expression | Average normalized expression across samples. | Sufficient for reliable detection (e.g., TPM > 5) | ||
| Annotation | Known protein domains (e.g., NBS-LRR, kinase). | Presence of R-gene motifs boosts priority |
Table 1: Example Prioritized Gene List from a Simulated BSR-Seq Study on Fusarium Head Blight Resistance in Wheat
| Gene ID | Chr Position (Mb) | log2FC (R/S) | q-value | BaseMean TPM | Annotation | Priority Rank |
|---|---|---|---|---|---|---|
| TraesCS2B02G123456 | Chr2B: 16.7 | 5.8 | 1.2E-10 | 45.2 | NBS-LRR class disease resistance protein | 1 |
| TraesCS2B02G123457 | Chr2B: 16.5 | 3.2 | 4.5E-06 | 12.1 | Receptor-like kinase | 2 |
| TraesCS2B02G123458 | Chr2B: 17.2 | 1.5 | 0.03 | 89.4 | Unknown function | 3 |
| TraesCS2B02G123459 | Chr2B: 15.8 | -0.8 | 0.25 | 120.5 | Peroxidase | Low |
Experimental Protocols
Protocol 5.1: Delineating the Candidate Region from BSR-Seq Data
Objective: To define the precise genomic interval harboring the candidate resistance gene using SNP-index analysis.
Materials: High-performance computing cluster, BSR-Seq alignment files (.bam), reference genome and annotation (.gff3), software (QTLseqr, R-ggplot2).
Methodology:
- Variant Calling: Using tools like GATK or bcftools, call SNPs from the R- and S-pool BAM files. Generate a VCF file.
- SNP-index Calculation: For each SNP, calculate the SNP-index (ratio of alternative allele reads to total reads) in both R and S pools.
- Δ(SNP-index) Derivation: Compute Δ(SNP-index) = (SNP-indexR) - (SNP-indexS) for each SNP.
- Statistical Smoothing: Apply a sliding window (e.g., 2 Mb) across the genome to calculate the average Δ(SNP-index). Generate confidence intervals (e.g., 95%, 99%) via permutation testing or simulation.
- Peak Identification: Visually inspect the Δ(SNP-index) plot. Define the candidate region as the continuous interval where the smoothed Δ(SNP-index) curve exceeds the 99% confidence threshold. Record the chromosomal start and end coordinates.
Protocol 5.2: Differential Expression Analysis for Gene Prioritization
Objective: To identify differentially expressed genes within the candidate region between resistant and susceptible bulks.
Materials: RNA-Seq count data (from BSR-Seq libraries or independent expression experiment), statistical software (R with DESeq2/edgeR), gene annotation file.
Methodology:
- Data Preparation: Create a count matrix of raw reads mapped to each gene for each sample (R-pool replicates, S-pool replicates).
- Normalization & Modeling: Load the matrix into DESeq2. Perform median-of-ratios normalization and fit a negative binomial generalized linear model, with the condition (R vs. S) as the main factor.
- Statistical Testing: Execute the Wald test for each gene to compute log2 fold changes, p-values, and adjusted p-values (Benjamini-Hochberg).
- Filtering for Candidate Region: Subset the list of all differentially expressed genes (e.g., q-value < 0.05) to only those located within the genomic coordinates defined in Protocol 5.1.
- Prioritization & Ranking: Sort the filtered list first by statistical significance (q-value), then by magnitude of induction (log2FC, descending). Integrate functional annotation to highlight genes with known resistance-related domains.
Mandatory Visualization
Prioritization Workflow for BSR-Seq Candidates
The Scientist's Toolkit: Research Reagent Solutions
| Item | Function / Application |
|---|---|
| DESeq2 (R/Bioconductor) | Primary software package for statistical analysis of differential gene expression from RNA-Seq count data. |
| QTLseqr (R Package) | Specifically designed for analysis of BSR-Seq data; calculates SNP-index and Δ(SNP-index) and performs significance testing. |
| Integrative Genomics Viewer (IGV) | Visualization tool for simultaneously inspecting aligned reads (BAM), SNP frequencies, and gene annotations across the candidate region. |
| NucleoSpin RNA Plant Kit | For high-quality total RNA extraction from plant tissues post-pathogen inoculation, essential for downstream RNA-Seq. |
| Illumina Stranded mRNA Prep | Library preparation kit for generating sequencing-ready cDNA libraries from poly-A enriched mRNA. |
| Pfam Database | Curated database of protein families and domains, used to annotate candidate genes for the presence of NBS, LRR, kinase, etc., domains. |
| snpEff | Variant annotation and effect prediction tool. Used to predict the functional impact of high-frequency SNPs within the candidate region on gene products. |
Navigating Challenges: Troubleshooting and Optimizing Your BSR-Seq Experiment
Within the broader thesis on utilizing Bulked Segregant RNA-Seq (BSR-Seq) for plant disease resistance (R) gene identification, two pre-analytical pitfalls critically compromise statistical power and mapping resolution: weak phenotypic contrast between bulks and contamination within bulks. This document provides detailed application notes and protocols to mitigate these issues.
Quantifying the Impact of Phenotypic Contrast and Bulk Purity
The efficacy of BSR-Seq hinges on the clear separation of individuals into distinct phenotypic bulks. Weak contrast or cross-contamination dilutes allele frequency differences at the causal locus, requiring greater sequencing depth and complicating SNP calling.
Table 1: Impact of Phenotypic Misclassification on SNP Enrichment Signal
| Parameter | Optimal Bulk (Clear Contrast) | Weak Contrast/Contaminated Bulk | Consequence |
|---|---|---|---|
| Phenotypic Accuracy | >98% correct classification | 80-90% correct classification | Reduced Δ(SNP-index) at true locus. |
| Expected Δ(SNP-index) | ~0.8 - 1.0 | Can fall to <0.3 | Signal may fall below statistical significance threshold. |
| Required Sequencing Depth | 30-50x per bulk | May require >80x per bulk | Increased cost and computational load. |
| Background Noise | Low even in polyploid genomes | Highly inflated, mimics polygenic traits | False positive peaks in unlinked genomic regions. |
Table 2: Common Sources of Bulking Contamination and Detection Methods
| Contamination Source | Preventive Protocol | Diagnostic Check (Post-RNA-Seq) |
|---|---|---|
| Field Splash/Cross-Inoculation | Physical barriers between plots, staggered inoculation. | Check for pathogen reads in the resistant bulk; align RNA-Seq data to pathogen genome. |
| Asymptomatic Carriers (Escapes) | Multiple, staggered disease scoring. | Population genetics analysis (e.g., PCA) of bulk samples may show outliers. |
| Seed Heterogeneity (Off-Types) | Use verified inbred lines, single-seed descent. | Check for unexpected heterozygosity or allele frequencies at known parental marker loci. |
| RNA Cross-Contamination | Separate labs for processing, dedicated equipment, RNAse decontamination. | Sample-level correlation metrics; unusually high correlation between bulk expression profiles. |
Detailed Experimental Protocols
Protocol A: Rigorous Phenotyping for High-Contrast Bulk Construction
Objective: To classify plants into resistant (R) and susceptible (S) bulks with minimal error. Materials: Defined pathogen inoculum, controlled environment growth facilities, scoring rubric.
- Experimental Design: Use a fully randomized block design. Include replicated positive and negative controls.
- Inoculation: Apply a standardized, high-titer inoculum synchronously to all plants at the same developmental stage. Use multiple inoculation methods (e.g., spray, injection) if applicable to ensure penetration.
- Longitudinal Scoring: Score disease symptoms at minimum at 24h, 48h, 72h, and 7 days post-inoculation (dpi) using a quantitative scale (e.g., 0-5). Photograph all individuals at each time point.
- Final Classification: Only pool tissue from plants showing extreme and consistent phenotypes. The ideal R-bulk plant shows no symptoms (score 0); the ideal S-bulk plant shows severe, progressive symptoms (score 4-5). Discard all intermediate or inconsistent responders.
- Tissue Harvest: Harvest tissue (e.g., lesion border for S-bulk, equivalent tissue site for R-bulk) at the predetermined peak contrast time point, immediately flash-freeze in liquid N₂.
Protocol B: Minimizing and Detecting Bulk Contamination
Objective: To ensure genetic and pathogenic purity of each bulk. Materials: Physical barriers, clean lab equipment, RNA stabilization reagents, pathogen-specific PCR assays.
- Spatial Separation: Grow and inoculate R and S populations in separate, distanced growth chambers or with solid physical barriers in the same chamber to prevent cross-contamination.
- Genotypic Validation Pre-Pooling: Prior to pooling, genotype each individual plant at 2-3 known polymorphic marker loci across the genome to confirm lineage and identify off-types. Remove any genetic outliers.
- Pathogen Load Check: For each individual plant destined for a bulk, perform a pathogen-specific qPCR (on a small, separate tissue sample) to confirm:
- S-bulk individuals: High pathogen load.
- R-bulk individuals: Undetectable or negligible pathogen load. Discard any R-phenotype plant showing significant pathogen DNA.
- RNA Extraction & Pooling: Perform RNA extraction for each individual plant separately in a clean environment. Quantify RNA integrity (RIN >7) and concentration. Only then combine equimolar amounts of RNA from each pre-validated individual to create the R and S bulks.
The Scientist's Toolkit: Research Reagent Solutions
| Item | Function in BSR-Seq Pitfall Mitigation |
|---|---|
| Pathogen-Specific qPCR Probe Assay | Quantifies pathogen biomass in plant tissue; essential for diagnosing "escape" plants contaminating the R-bulk. |
| SNP-based CAPS/dCAPS Markers | For genotypic validation of plant lineage pre-pooling, eliminating seed mix-up or off-type contamination. |
| RNA Stabilization Reagent (e.g., RNAlater) | Preserves transcriptome integrity immediately upon harvest, preventing stress-response gene expression changes that blur phenotypic contrast. |
| High-Fidelity DNA/RNA Cleanup Beads | Prevents cross-contamination between samples during nucleic acid purification steps. |
| Indexed RNA-Seq Library Prep Kits | Allows multiplexing of individual plant libraries. Sequencing individuals separately (though costly) completely eliminates bulking contamination and enables perfect re-bulking post-phenotyping. |
Visualizations
Title: BSR-Seq Workflow: Optimal vs. Pitfall Paths
Title: Cascade from Pitfalls to Mapping Failure
Within the context of Bulk Segregant RNA-Seq (BSR-Seq) for plant disease resistance (R) gene identification, achieving statistically robust results hinges on adequate sequencing depth and uniform coverage. Insufficient depth fails to capture low-abundance, tissue-specific, or allelic variants of transcripts critical for resistance signaling. Coverage bias, often from GC-content variation, library preparation artifacts, or RNA integrity issues, can skew allele frequency estimates in bulked segregant pools, leading to false-negative or false-positive candidate region identification.
Table 1: Recommended Sequencing Depth for BSR-Seq in Plant R-Gene Identification
| Plant Genome Size | Minimum Total Reads per Bulk (Pool) | Target Depth for Polygenic Traits | Key Rationale & Supporting References |
|---|---|---|---|
| Small (~125 Mb, e.g., Arabidopsis) | 30-40 Million | 50-60 Million | Enables detection of low-expressed pathogenesis-related (PR) genes. Liu et al. (2020) Plant Methods found <20M reads missed 15% of differentially expressed R-gene candidates. |
| Medium (~450 Mb, e.g., Tomato) | 40-50 Million | 60-80 Million | Required for comprehensive coverage of complex NBS-LRR gene families. A study by Fu et al. (2022) Front Plant Sci showed 40M reads gave 90% power to detect eQTLs in bulks. |
| Large (~3 Gb, e.g., Wheat) | 60-80 Million | 100-150 Million | Compensates for high proportion of repetitive regions and low mappability. Recent protocols (Kumar et al., 2023 Plant Biotechnol J) use 100M reads as standard for hexaploid crops. |
Table 2: Common Sources of Coverage Bias and Mitigation Strategies
| Bias Source | Impact on BSR-Seq | Quantitative Measure (Typical Range) | Corrective Protocol |
|---|---|---|---|
| GC Content | Low/High GC regions show reduced coverage. | Fold-coverage difference can be 2-5x. | Use PCR-free library kits or limit PCR cycles to <12. Normalize using in silico GC correction tools. |
| RNA Integrity | Degradation causes 3’ bias. | RNA Integrity Number (RIN) <7.0 leads to >30% 3’ bias. | Strict QC: use only samples with RIN ≥8.5. Employ rRNA depletion over poly-A selection for broader transcriptome. |
| Library Insert Size | Short inserts over-represented. | Deviation from median insert size >30% indicates bias. | Optimize fragmentation and size selection using automated gel-free systems (e.g., SPRIselect). |
| Bulked Pool Construction | Unequal individual contribution skews allele frequencies. | Individual contribution variance should be <10%. | Precisely normalize input RNA by concentration and quality (Bioanalyzer) before pooling. |
Experimental Protocols
Protocol 1: Determining Optimal Sequencing Depth via Power Simulation
Objective: To computationally estimate required read depth for detecting significant allele frequency shifts in bulked pools. Materials: Preliminary genotype data (SNPs), pilot RNA-seq data from parental lines. Procedure:
- Data Input: Use genotypes from resistant (R) and susceptible (S) parental lines to define SNPs.
- Simulation Parameters: Define a realistic effect size (e.g., 20% allele frequency shift between R and S bulks at causal locus) and acceptable power (e.g., 90%).
- Run Simulation: Utilize tools like
PROC POWERin SAS or thepwrpackage in R. Input variables: genome size, expected polymorphism rate, bulk size (number of individuals), and test significance threshold (e.g., adjusted p-value < 0.01). - Depth Calculation: The simulation outputs the minimum depth (reads per SNP) needed. Convert to total reads per bulk: Total Reads = (SNPs Genome-wide * Depth per SNP) / (Mappability Rate). A mappability rate of 0.6-0.7 is typical for plants.
- Validation: Sequence a positive control gene region at the simulated depth and a lower depth. Compare allele frequency confidence intervals.
Protocol 2: Assessing and Correcting for GC Bias
Objective: To quantify and mitigate GC-dependent coverage bias in BSR-Seq libraries. Materials: Raw sequencing reads (FASTQ), reference genome. Procedure:
- Coverage Calculation: Map reads to reference using HISAT2 or STAR. Calculate per-base coverage with
samtools depth. - GC Content Bin: Calculate GC percentage for non-overlapping 100-bp windows across the genome.
- Plot Correlation: Generate a plot of normalized coverage (log2) versus GC percentage. A parabolic curve indicates bias.
- Apply Correction: Use a tool like
gcnorm(in thecqnR package) orDESeq2's normalization which internally models GC bias. Inputs are read counts per window and corresponding GC values. - Post-Correction QC: Re-plot the correlation. Successful correction shows a flat, horizontal relationship.
Mandatory Visualization
Diagram 1 Title: BSR-Seq Workflow with Critical Quality Control Checkpoints
Diagram 2 Title: How Sequencing Bias Leads to False Negatives in BSR-Seq
The Scientist's Toolkit: Research Reagent Solutions
Table 3: Essential Reagents and Kits for Robust BSR-Seq Library Preparation
| Item Name | Vendor Examples | Function in Mitigating Depth/Bias Pitfalls | Critical Usage Note |
|---|---|---|---|
| High-Fidelity, PCR-Free Library Prep Kit | Illumina DNA PCR-Free Prep; NEB Next Ultra II FS | Eliminates PCR amplification bias, ensuring uniform coverage across GC-rich and GC-poor regions. | Essential for whole-transcriptome studies. Use input RNA amounts at kit's upper limit for maximum complexity. |
| Ribo-depletion Kit (Plant-specific) | Illumina Ribo-Zero Plant; QIAseq FastSelect –rRNA Plant | Removes abundant ribosomal RNA without 3' bias of poly-A selection, capturing non-polyadenylated regulatory RNAs. | Superior to poly-A for degraded or non-coding RNA analysis. Validate for your specific plant species. |
| Automated Nucleic Acid Size Selector | Beckman Coulter SPRIselect; Sage Science PippinHT | Provides precise size selection of cDNA fragments, minimizing insert size bias and improving library uniformity. | Calibrate selection range to target median insert size of 200-300 bp for optimal cluster density. |
| RNA Integrity QC System | Agilent Bioanalyzer 2100 / TapeStation | Precisely measures RIN or RQN to screen out degraded samples that cause severe 3'/5' coverage bias. | Set strict cutoff (RIN ≥8.5) for pool inclusion. Do not rely on spectrophotometry alone. |
| Dual-index UMI Adapter Kits | IDT for Illumina UMI kits; Twist Unique Dual Indexes | Unique Molecular Identifiers (UMIs) enable accurate PCR duplicate removal, providing true molecular counts and correcting for amplification bias. | Crucial for accurate allele frequency estimation from amplified libraries. |
1. Introduction & Thesis Context Within a thesis employing Bulk Segregant RNA-Seq (BSR-Seq) for plant disease resistance (R) gene identification, the signal-to-noise ratio is paramount. The core challenge lies in distinguishing true, resistance-linked single nucleotide polymorphisms (SNPs) from the background of sequencing errors, alignment artifacts, and natural genomic variation. This protocol details a systematic approach to optimize variant calling and filtering parameters to generate a cleaner, more reliable signal for pinpointing candidate genomic regions.
2. Key Parameter Optimization Table
The following parameters in GATK's HaplotypeCaller and VariantFiltration modules are critical. Optimal ranges are derived from recent benchmarks (2023-2024) in plant BSR-Seq studies.
Table 1: Core SNP Calling & Filtering Parameters for BSR-Seq Optimization
| Tool/Step | Parameter | Typical Default | Optimized Range (BSR-Seq) | Rationale & Impact |
|---|---|---|---|---|
| HaplotypeCaller | --min-base-quality-score (Q) |
10 | 20-25 | Reduces false positives from sequencing errors. |
| HaplotypeCaller | --stand-call-conf (confidence threshold) |
10 | 20-30 | Increases stringency for initial variant call. |
| VariantFiltration | QD (Quality by Depth) |
2.0 | > 5.0 - 10.0 | Filters variants with low confidence relative to coverage. |
| VariantFiltration | MQ (RMS Mapping Quality) |
40.0 | > 50.0 - 60.0 | Removes variants in regions with poor alignment. |
| VariantFiltration | FS (Fisher Strand) |
60.0 | < 20.0 - 30.0 | Filters variants with strand bias (indicator of artifact). |
| VariantFiltration | SOR (StrandOddsRatio) |
3.0 | < 2.0 - 3.0 | Modern, more robust metric for strand bias. |
| VariantFiltration | DP (Depth) |
- | Cohort-specific percentile (e.g., 5 | Removes extremely low and high coverage sites. |
| Custom Filter | Allele Frequency Delta (ΔAF) |
- | > 0.6 - 0.8 between bulks | Crucial for BSR: Selects SNPs strongly associated with phenotype. |
*DP should be adjusted based on your sequencing depth profile.
3. Detailed Experimental Protocols
Protocol 3.1: Iterative SNP Filtering Workflow for BSR-Seq Objective: To progressively refine variant calls and identify high-confidence, phenotype-associated SNPs. Input: Aligned BAM files for Resistant (R) and Susceptible (S) bulks. Software: GATK (v4.4+), BCFtools, custom Python/R scripts.
Joint Variant Calling:
Hard Filtering on Annotation Metrics:
Depth-based Filtering: Calculate median depth per bulk using
bcftools query -f '%DP\n'. Filter sites where depth in either bulk is < 5th or > 95th percentile of genome-wide distribution.Phenotype Association Filter (ΔAF): Extract allele frequencies (AF) for each bulk using
bcftools +fill-tags. Apply a custom script to calculate ΔAF = |AFR - AFS|.Script
filter_by_af.pyretains SNPs where ΔAF ≥ threshold (e.g., 0.7).Visual Validation: Integrate candidate SNP positions into a genome browser (e.g., IGV) alongside read alignments to confirm clean signals.
Protocol 3.2: Validation via Sanger Sequencing Objective: Confirm a subset of high-priority SNPs from the computational pipeline. Materials: Genomic DNA from original pool individuals, primers flanking SNP. Procedure:
- Design primers using Primer3 to generate 300-500 bp amplicons.
- Perform PCR amplification on individual R and S plant DNA.
- Purify PCR products and submit for Sanger sequencing.
- Align sequences to the reference using Clustal Omega; manually inspect chromatograms at target SNP positions to confirm polymorphism and its segregation with the phenotype.
4. Mandatory Visualizations
BSR-Seq SNP Filtering Optimization Workflow
From BSR-Seq to Candidate R Gene
5. The Scientist's Toolkit: Research Reagent Solutions
Table 2: Essential Materials for BSR-Seq Variant Analysis
| Item / Solution | Supplier Examples | Function in Protocol |
|---|---|---|
| High-Fidelity RNA Extraction Kit (e.g., Plant RNeasy) | Qiagen, Zymo Research | Isolates intact, DNA-free RNA from resistant/susceptible plant tissue pools for sequencing. |
| mRNA-Seq Library Prep Kit (e.g., TruSeq Stranded mRNA) | Illumina, NEBNext | Prepares strand-specific, multiplexed cDNA libraries for Illumina sequencing. |
| Genomic DNA Extraction Kit (for validation) | Qiagen, Thermo Fisher | Provides template DNA for Sanger sequencing validation of candidate SNPs. |
| GATK Software Suite | Broad Institute | Industry-standard toolkit for variant discovery; executes core calling/filtering steps. |
| BCFtools/VCFtools | Genome Research Ltd. | Lightweight utilities for manipulating, filtering, and annotating VCF files. |
| IGV (Integrative Genomics Viewer) | Broad Institute | Enables visual inspection of read alignments and variant calls across bulks. |
| Sanger Sequencing Service | Genewiz, Eurofins | Provides confirmatory, gold-standard sequencing of PCR amplicons for SNP validation. |
Application Notes
Integrating transcriptomic, co-expression, and functional annotation data within a BSR-Seq (Bulked Segregant RNA-Seq) framework provides a powerful, multi-omics strategy for rapid candidate gene identification. The core application is the prioritization of plant disease resistance (R) genes from a pool of differentially expressed genes (DEGs) identified via BSR-Seq. By constructing condition-specific co-expression networks, researchers can move beyond simple differential expression to identify key regulatory modules and hub genes central to the defense response. Subsequent integration with functional annotations—such as Gene Ontology (GO) enrichment, protein domain analysis (e.g., NB-ARC, LRR, TIR), and pathway mapping—provides biological context and validates the role of candidates in known resistance mechanisms. This layered approach significantly reduces false positives and pinpoints high-probability R gene candidates for downstream functional validation.
Table 1: Quantitative Data Summary from a Hypothetical BSR-Seq Study for R Gene Identification
| Analysis Layer | Metric | Value | Interpretation |
|---|---|---|---|
| RNA-Seq Alignment | Total Reads (Bulks) | 40M each | Sufficient depth for variant calling |
| Mapping Rate | >95% | High-quality reference alignment | |
| Variant Calling | SNPs in QTL Region | 1,245 | Polymorphisms between resistant/susceptible bulks |
| Indels in QTL Region | 187 | Structural variants for consideration | |
| Differential Expression | Total DEGs (FDR<0.05) | 1,850 | Transcriptional response to pathogen |
| Up-regulated DEGs | 1,220 | Potential defense-activated genes | |
| Co-expression Analysis | Modules Identified (WGCNA) | 12 | Distinct expression programs |
| Module-Trait Correlation (Defense) | 0.92 (Module 3) | Strong association with resistance phenotype | |
| Hub Genes in Key Module | 15 | Top-connected genes in defense network | |
| Functional Annotation | DEGs with NB-LRR Domain | 42 | Canonical R gene candidates |
| Enriched GO Term (Biological Process) | "Defense Response" (p=3.2e-12) | Confirms biological relevance |
Protocols
Protocol 1: BSR-Seq Workflow for Bulk Construction and Sequencing
Objective: To identify genomic regions and transcripts associated with disease resistance by sequencing RNA from phenotypically extreme bulked samples.
Materials:
- Plant populations (F2, RILs, etc.) segregating for resistance.
- Pathogen inoculum.
- TRIzol Reagent or equivalent for total RNA extraction.
- mRNA enrichment kits (poly-A selection).
- Strand-specific cDNA library preparation kit.
- High-throughput sequencer (Illumina NovaSeq, etc.).
Procedure:
- Phenotyping & Bulking: Inoculate the segregating population. Score for disease severity. Select 20-30 individuals from each extreme (highly resistant, R-bulk; highly susceptible, S-bulk). Pool equal amounts of leaf tissue from each individual within a bulk.
- Total RNA Extraction: Isolate total RNA from each bulk using TRIzol, incorporating a DNase I treatment. Assess integrity (RIN > 7.0 via Bioanalyzer) and quantify.
- Library Preparation & Sequencing: Enrich for mRNA using poly-A beads. Prepare strand-specific, paired-end (150bp) cDNA libraries. Sequence each bulk to a minimum depth of 30 million reads per sample on an Illumina platform.
Protocol 2: Integrated Co-expression and Functional Annotation Pipeline
Objective: To construct a condition-specific gene co-expression network from BSR-Seq DEGs and integrate functional data to prioritize hub R gene candidates.
Materials:
- High-performance computing cluster or server.
- R statistical software with packages:
DESeq2/EdgeR,WGCNA,clusterProfiler. - Reference genome and annotation file (GFF3/GTF) for the plant species.
- Public databases: GO, Pfam, KEGG, PRGdb.
Procedure:
- DEG Identification: Map reads to the reference genome (HISAT2/STAR). Generate count matrices. Identify DEGs between R- and S-bulks using
DESeq2(FDR-adjusted p-value < 0.05, |log2FoldChange| > 1). - Co-expression Network Construction: Input normalized expression values of all DEGs into the
WGCNApackage.- Choose a soft-thresholding power (β) to achieve scale-free topology (R^2 > 0.85).
- Construct an adjacency matrix and transform to a Topological Overlap Matrix (TOM).
- Perform hierarchical clustering on TOM-based dissimilarity to identify co-expression modules.
- Correlate module eigengenes with the resistance trait to identify the most relevant module(s).
- Extract intramodular connectivity (kWithin) to identify hub genes within the key module(s).
- Functional Annotation Integration:
- Domain Analysis: Perform Pfam scan on hub gene protein sequences to identify NB-ARC, LRR, TIR, RLK domains.
- GO/KEGG Enrichment: Use
clusterProfilerto test the key co-expression module genes for enrichment in defense-related GO terms and KEGG pathways (e.g., plant-pathogen interaction). - Prioritization: Generate a candidate shortlist by intersecting high-connectivity hub genes, genes containing R gene domains, and genes residing within the BSR-seq identified QTL region.
Research Reagent Solutions Toolkit
Table 2: Essential Research Reagents and Materials
| Item | Function in BSR-Seq & Omics Integration |
|---|---|
| TRIzol Reagent | Simultaneous extraction of high-quality total RNA, DNA, and protein from plant tissues. Critical for obtaining intact RNA for sequencing. |
| Poly(A) mRNA Magnetic Beads | Selective enrichment of eukaryotic mRNA from total RNA by binding poly-A tails, reducing ribosomal RNA contamination in libraries. |
| Strand-Specific RNA-seq Kit | Preserves the directionality of transcription during library prep, essential for accurate annotation and sense/antisense expression analysis. |
| NovaSeq 6000 S4 Flow Cell | High-output flow cell for Illumina sequencing, enabling deep coverage of multiple bulked samples cost-effectively. |
| WGCNA R Package | Algorithmic toolkit for constructing weighted gene co-expression networks, identifying modules, and calculating hub gene connectivity. |
| clusterProfiler R Package | Statistical tool for functional profiling (GO, KEGG) of gene clusters, enabling biological interpretation of DEGs and network modules. |
| Pfam Database | Curated collection of protein families and domains (HMMs). Used via hmmscan to identify conserved R gene domains in candidate sequences. |
Visualizations
Title: BSR-Seq Integrated Omics Analysis Workflow
Title: Gene Prioritization via Co-expression & Annotation
Best Practices for Replication and Minimizing False-Positive Associations
This application note outlines rigorous protocols for Bulked Segregant RNA-Seq (BSR-Seq) in the identification of plant disease resistance (R) genes. It provides a framework for experimental design, execution, and data analysis to ensure robust replication and minimize spurious associations, a critical consideration for downstream applications in agricultural biotechnology and drug development targeting plant-pathogen interactions.
Core Principles for Robust BSR-Seq
Experimental Design & Biological Replication
False-positive associations primarily arise from inadequate biological replication and confounding batch effects. A minimum experimental design is presented below.
Table 1: Minimum Replication Schema for BSR-Seq in R-Gene Identification
| Component | Minimum Recommended Replication | Rationale |
|---|---|---|
| Biological Replicates (Plant Lines) | 3-5 independent resistant (R) and susceptible (S) pools, each derived from distinct F2/F3 populations. | Controls for genetic and environmental variance within the bulks. |
| Technical Sequencing Replicates | 2 library preparations per biological pool (if starting material allows). | Controls for library construction bias. |
| Sequencing Depth | ≥30 million paired-end reads per bulk sample. | Ensures sufficient coverage for SNP calling and allele frequency estimation in polyploid species. |
| Negative Control Bulk | A bulk from a population segregating for a neutral trait. | Identifies background, non-linked frequency differences. |
Sample Preparation & Bulking Protocol
Protocol: Construction of Phenotypically Extreme Bulks for BSR-Seq Objective: To create genetically homogenous, phenotypically distinct RNA pools from a segregating plant population.
Materials:
- F2 or F3 population from a cross between Resistant (R) and Susceptible (S) parents.
- Pathogen inoculum for controlled infection.
- RNA stabilization reagent (e.g., RNAlater).
- Tissue homogenizer.
- Total RNA extraction kit with on-column DNase I treatment.
- Qubit Fluorometer and Bioanalyzer/TapeStation for QC.
Procedure:
- Phenotyping: Inoculate all individuals in the segregating population under controlled environmental conditions. Assign a quantitative disease index (DI) score (e.g., 0=no symptoms, 5=severe necrosis) at the peak disease response timepoint.
- Bulk Formation:
- R Bulk: Select 15-20 individuals with the most extreme resistance (lowest DI scores).
- S Bulk: Select 15-20 individuals with the most extreme susceptibility (highest DI scores).
- Note: The individuals selected for each bulk must be mutually exclusive. Tissue (e.g., infected leaf sections) from each selected plant is collected, flash-frozen, and stored at -80°C.
- RNA Extraction & Pooling:
- Extract total RNA from each individual plant tissue sample separately. Quantify and assess quality (RIN ≥7.0).
- Equimolar Pooling: Combine equal RNA mass or molar amounts from each individual within the R group to form the R bulk. Repeat for the S group.
- Alternative Protocol (if high-throughput phenotyping is used): Tissue from selected plants can be physically pooled prior to homogenization and RNA extraction. This is faster but riskier; ensure tissue mass is equal per plant.
Bioinformatics & Statistical Thresholds
Protocol: Variant Calling and Association Analysis Objective: To identify SNPs with significantly divergent allele frequencies between R and S bulks, indicating linkage to a candidate R-gene locus.
Workflow:
- Read Alignment & Processing:
- Trim adapters and low-quality bases using Trimmomatic or fastp.
- Align cleaned reads to the reference genome using STAR or HISAT2.
- Process alignments (sort, mark duplicates) using samtools or Picard.
- Variant Calling:
- Use
bcftools mpileupandcallto identify SNPs in each bulk separately. - Hard Filter: Apply quality filters (e.g., QUAL>30, DP>10, GQ>20).
- Use
- Association Metric Calculation:
- Calculate the SNP index (ratio of reads carrying the alternative allele) for each bulk at all polymorphic positions.
- Compute the Δ(SNP-index) = SNP-index(R bulk) - SNP-index(S bulk).
- Statistical Significance:
- Simulate or calculate a 95% and 99% confidence interval for the Δ(SNP-index) under the null hypothesis of no linkage using a permutation approach or published models (e.g., sliding window analysis).
- Replication Check: A true association must be present in the majority of independent biological replicate bulk comparisons.
Table 2: Key Bioinformatics Filtering Steps to Minimize False Positives
| Filter | Typical Threshold | Purpose |
|---|---|---|
| Overall Read Depth | 10x - 100x (per bulk) | Exclude low-coverage, noisy SNPs. |
| Bulk Allele Frequency Delta | Δ(SNP-index) ≥ 0.8 for major effect candidates | Focuses on near-fixation differences. |
| Confidence Interval | Must exceed 95% (prefer 99%) simulated CI | Statistical significance threshold. |
| Physical Clustering | Multiple significant SNPs within a 1-5 Mb genomic window | Isolated SNPs are likely technical artifacts. |
| Replication across Biological Bulks | Association observed in ≥2/3 independent R/S bulk pairs | The most critical filter for false-positive reduction. |
The Scientist's Toolkit: Research Reagent Solutions
Table 3: Essential Reagents & Kits for BSR-Seq in R-Gene Identification
| Item | Function & Rationale |
|---|---|
| RNAlater Stabilization Solution | Preserves RNA integrity in field-collected or pathogen-infected tissue prior to homogenization, critical for accurate transcript representation. |
| Poly(A) mRNA Magnetic Bead Kit | For mRNA enrichment prior to library prep, reduces ribosomal RNA contamination, improving functional variant discovery in coding regions. |
| Strand-Specific RNA Library Prep Kit | Maintains strand information, allowing accurate assignment of reads to sense/antisense transcripts and non-coding RNAs near candidate loci. |
| Duplex-Specific Nuclease (DSN) | Normalizes cDNA libraries by degrading abundant transcripts, increasing sequencing depth for rare, differentially expressed transcripts linked to resistance. |
| PCR-Free Library Prep Kit | Recommended for organisms with complex genomes; eliminates PCR duplicate bias and GC-content artifacts during library amplification. |
| Phusion High-Fidelity DNA Polymerase | For limited amplification steps; essential for maintaining accurate sequence representation with ultra-low error rate. |
| Indexed Adapters (Dual Index, Unique) | Enables multiplexing of many biological replicates in a single sequencing lane, controlling for inter-lane batch effects and reducing costs. |
Visualized Workflows & Pathways
Diagram 1: BSR-Seq Experimental & Analysis Workflow
Diagram 2: Key Signaling Pathway in Plant Disease Resistance
Beyond Mapping: Validating BSR-Seq Candidates and Comparing Methodological Efficacy
Application Notes
Within a BSR-Seq (Bulked Segregant RNA-Seq) workflow for identifying plant disease resistance (R) genes, candidate gene validation is the critical, multi-stage process that transforms correlative expression data into confirmed genetic function. Following the identification of candidate genes via differential expression analysis from resistant and susceptible bulks, three sequential validation pillars are employed: transcriptional validation via qRT-PCR, functional validation via CRISPR-Cas9 knockout, and confirmatory validation via transgenic complementation. This integrated approach provides rigorous, multi-layered evidence, moving from expression correlation to causal necessity and finally to sufficiency for the resistant phenotype.
1. Transcriptional Validation via qRT-PCR: BSR-Seq provides expression profiles, but qRT-PCR is essential for validating the differential expression of specific candidates in individual plant lines under pathogen challenge. This step confirms the RNA-Seq data, provides higher sensitivity for temporal expression studies, and verifies expression patterns in the original mapping population parents and near-isogenic lines (NILs). A failure at this stage suggests the candidate may be a differentially expressed gene downstream of the true R gene or a false positive.
2. Functional Validation via CRISPR-Cas9 Knockout: Establishing the necessity of a candidate gene for resistance is achieved by disrupting its function in a resistant genotype. CRISPR-Cas9-mediated knockout is the contemporary standard for generating loss-of-function mutants. The conversion of a resistant plant to susceptibility upon targeted gene editing provides definitive evidence that the candidate is required for the immune response. This step directly tests the gene's function, bypassing the need for pre-existing mutant collections.
3. Confirmatory Validation via Transgenic Complementation: The final step establishes sufficiency. The candidate gene is introduced into a susceptible genotype (often the recurrent parent or a susceptible variety) via transformation. The restoration of resistance in the transgenic lines provides the ultimate proof that the identified gene is both necessary and sufficient to confer the resistance phenotype observed in the original BSR-Seq study. This step rules out the possibility that the CRISPR-Cas9 phenotype was due to off-target effects or that the gene requires a specific genetic background.
Protocols
Protocol 1: qRT-PCR Validation of Candidate Genes
Objective: To verify the differential expression of BSR-Seq-derived candidate R genes between resistant and susceptible genotypes post-inoculation.
Materials:
- RNA from pathogen-inoculated and mock-treated leaves (biological replicates, n≥3).
- DNase I.
- Reverse transcription kit (oligo(dT) and/or random primers).
- Gene-specific primers (amplicon 80-200 bp).
- qPCR Master Mix (SYBR Green or probe-based).
- Validated reference genes (e.g., EF1α, ACTIN, UBIQUITIN).
Method:
- cDNA Synthesis: Treat total RNA with DNase I. Perform reverse transcription on equal amounts of RNA (e.g., 1 µg) using a robust cDNA synthesis kit. Include a no-reverse transcriptase (-RT) control for each sample to detect genomic DNA contamination.
- Primer Design & Validation: Design primers spanning an intron-exon junction. Validate primer efficiency (90-110%) and specificity via standard curve and melt curve analysis.
- qPCR Reaction: Set up reactions in triplicate (technical replicates). Use a 10-20 µL reaction volume containing 1x Master Mix, gene-specific primers, and diluted cDNA template.
- Thermocycling: Standard two-step protocol: Initial denaturation (95°C, 2 min); 40 cycles of denaturation (95°C, 15 sec) and annealing/extension/fluorescence acquisition (60°C, 1 min).
- Data Analysis: Calculate ∆Cq (Cq[target] - Cq[reference]) for each sample. Perform statistical analysis (e.g., Student's t-test) on ∆∆Cq values between conditions/genotypes.
Quantitative Data Table: qRT-PCR Validation of Candidate Gene RX-1
| Sample (Genotype:Treatment) | Mean Cq (RX-1) | Mean Cq (Ref Gene) | ∆Cq | ∆∆Cq (vs. Susc:Mock) | Relative Expression (2^-∆∆Cq) |
|---|---|---|---|---|---|
| Resistant: Mock | 28.5 ± 0.3 | 20.1 ± 0.2 | 8.4 | 0.0 | 1.0 ± 0.1 |
| Resistant: Inoculated | 24.2 ± 0.4 | 20.3 ± 0.2 | 3.9 | -4.5 | 22.6 ± 2.1* |
| Susceptible: Mock | 29.1 ± 0.3 | 20.0 ± 0.1 | 9.1 | 0.7 | 0.6 ± 0.1 |
| Susceptible: Inoculated | 28.8 ± 0.4 | 20.2 ± 0.2 | 8.6 | 0.2 | 0.9 ± 0.1 |
*P < 0.01 vs. Resistant:Mock.
Protocol 2: CRISPR-Cas9 Knockout for Functional Validation
Objective: To generate loss-of-function mutations in a candidate R gene within a resistant plant background and assess the change in phenotype.
Materials:
- Binary vector with plant-specific Cas9 and sgRNA expression cassettes.
- Agrobacterium tumefaciens strain (e.g., GV3101).
- Tissue culture media for plant transformation and regeneration.
- Target-specific sgRNA sequence.
- PCR genotyping primers flanking the target site.
- Restriction enzyme (if using CAPS assay) or T7 Endonuclease I for mutation detection.
Method:
- sgRNA Design & Construct Assembly: Design a 20-nt sgRNA targeting an early exon of the candidate gene, minimizing off-target potential. Clone the sgRNA into a binary CRISPR-Cas9 vector via Golden Gate or other assembly methods.
- Plant Transformation: Transform the resistant genotype via Agrobacterium-mediated transformation appropriate for the plant species (e.g., leaf disc for tomato, hypocotyl for Arabidopsis).
- Regeneration & Selection: Regenerate transgenic plants (T0) on selection media (e.g., kanamycin).
- Genotyping T0 Plants: Extract DNA from regenerated shoots. Amplify the target region by PCR. Screen for indels using the T7 Endonuclease I (T7EI) assay or by Sanger sequencing of PCR products. Sequence-confirmed mutant T0 plants are grown to set seed.
- Analysis of T1 Generation: Genotype T1 plants to identify those harboring bi-allelic or homozygous mutations. Challenge these plants with the pathogen in a controlled assay. Compare disease symptoms (e.g., lesion size, pathogen biomass) to wild-type resistant and susceptible controls.
Quantitative Data Table: CRISPR-Cas9 Phenotype Analysis in T1 Plants
| Plant Line (Genotype) | Mutation Type (Allele 1 / Allele 2) | Disease Score (0-5) | Pathogen Biomass (ng DNA/µg plant DNA) | Conclusion |
|---|---|---|---|---|
| Resistant Wild-Type | WT / WT | 1.2 ± 0.4 | 5.3 ± 1.8 | Resistant |
| Susceptible Wild-Type | WT / WT | 4.8 ± 0.2 | 152.7 ± 22.4 | Susceptible |
| RX-1-cr#1 | 1-bp del / 5-bp del | 4.5 ± 0.3* | 138.9 ± 18.6* | Susceptible (Knockout) |
| RX-1-cr#2 | WT / 7-bp ins | 2.1 ± 0.5 | 15.2 ± 5.1 | Partially Resistant (Heterozygote) |
*P < 0.001 vs. Resistant Wild-Type.
Protocol 3: Transgenic Complementation
Objective: To confer resistance by introducing the candidate R gene into a susceptible genotype.
Materials:
- Full-length genomic DNA or cDNA of the candidate gene (including native promoter or strong constitutive promoter).
- Binary overexpression vector (e.g., pCAMBIA1300).
- Susceptible plant line for transformation.
- Antibiotics for bacterial and plant selection.
- Pathogen inoculum for phenotyping.
Method:
- Construct Preparation: Clone the full-length candidate gene, including its native promoter and terminator, into a binary vector. Alternatively, for proof-of-concept, clone the cDNA under the control of a strong constitutive promoter (e.g., CaMV 35S).
- Transformation of Susceptible Host: Transform the susceptible genotype using standard methods for the species.
- Generation of Transgenic Lines: Select primary transformants (T0) on appropriate media. Confirm transgene integration by PCR and expression by qRT-PCR.
- Phenotypic Assay: Inoculate T1 or T2 transgenic lines (homozygous if possible) with the pathogen. Include negative controls (non-transformed susceptible plant) and positive controls (original resistant plant).
- Statistical Correlation: Perform a correlation analysis between transgene expression level (from qRT-PCR) and degree of resistance (e.g., pathogen growth inhibition).
Quantitative Data Table: Complementation Test in Transgenic T1 Lines
| Plant Line | Transgene Copy No. (Est.) | Relative RX-1 Expression | Disease Score (0-5) | Complementation Status |
|---|---|---|---|---|
| Susceptible Wild-Type | 0 | 1.0 ± 0.2 | 4.7 ± 0.2 | - |
| Resistant Wild-Type | 1 (native) | 22.5 ± 3.1 | 1.1 ± 0.3 | - |
| Comp#1 | 1 | 18.3 ± 2.5 | 1.4 ± 0.4 | Full |
| Comp#2 | 2 | 35.6 ± 4.8 | 1.0 ± 0.3 | Full |
| Comp#3 | 1 | 3.5 ± 0.9 | 3.8 ± 0.6 | Partial/Failed |
Diagrams
Title: Three-Pillar Validation Workflow from BSR-Seq to Confirmed R Gene
Title: Transgenic Complementation Protocol Flowchart
The Scientist's Toolkit: Research Reagent Solutions
| Item | Function in Validation Pipeline | Example/Note |
|---|---|---|
| High-Fidelity Reverse Transcriptase | Converts RNA to cDNA for accurate qRT-PCR quantification; essential for measuring low-abundance transcripts like some R genes. | Superscript IV, PrimeScript RT. |
| SYBR Green qPCR Master Mix | Enables detection of PCR amplification in real-time for qRT-PCR; cost-effective for primer validation and expression profiling. | PowerUp SYBR Green, TB Green Premix Ex Taq. |
| CRISPR-Cas9 Binary Vector | Plant transformation-ready plasmid containing Cas9 and sgRNA scaffold; allows modular cloning of target-specific sgRNAs. | pHEE401E (for Arabidopsis), pYLCRISPR/Cas9 (for monocots/dicots). |
| T7 Endonuclease I (T7EI) | Detects small insertions/deletions (indels) at CRISPR target sites by cleaving heteroduplex DNA; used for initial genotyping of T0 plants. | Often supplied as a genomic editing detection kit. |
| Plant-Specific Agrobacterium Strain | Engineered for efficient transformation of plant tissues; essential for delivering CRISPR and complementation constructs. | GV3101 (for Arabidopsis, tomato), EHA105 (for rice, soybean). |
| Gateway or Golden Gate Cloning Kit | Facilitates rapid, recombination-based assembly of multigene constructs for complementation or multiplex CRISPR. | Gateway LR Clonase, Golden Gate Assembly Kit (BsaI). |
| Pathogen-Specific Growth Medium | For culturing and maintaining the pathogen used for inoculation assays, ensuring consistent challenge doses. | e.g., V8 juice agar for oomycetes, King's B for Pseudomonas. |
| Pathogen Biomass Quantification Kit | Enables precise measurement of pathogen load in plant tissue (e.g., via qPCR of pathogen DNA); provides quantitative disease metrics. | Kits for fungal/oomycete DNA extraction & species-specific qPCR probes. |
| Tissue Culture-Grade Plant Growth Regulators | Critical for in vitro regeneration of transformed plants (CRISPR & complementation). Adjust ratios for callus induction, shoot, and root development. | 6-Benzylaminopurine (BAP), 1-Naphthaleneacetic acid (NAA). |
This application note supports a broader thesis on leveraging Bulked Segregant RNA-Seq (BSR-Seq) for rapid identification of plant disease resistance (R) genes. Traditional QTL mapping has been the cornerstone of plant genetics but presents limitations in resolution and speed for complex trait dissection. This document provides a direct, data-driven comparison between BSR-Seq and traditional QTL mapping, focusing on their application in plant immunity research, with detailed protocols and resource guidelines.
Table 1: Core Methodological & Performance Comparison
| Parameter | Traditional QTL Mapping (Bi-Parental Population) | BSR-Seq |
|---|---|---|
| Primary Input Material | Genomic DNA from large mapping population (~200-500 individuals). | Total RNA from two phenotypically extreme bulks (20-50 plants each). |
| Marker System | Pre-defined markers (SSRs, SNPs from array/chip). | Genome-wide SNPs called de novo from RNA-Seq data. |
| Time to Initial Mapping | 1-2 years (population development, genotyping). | 4-8 weeks (bulk creation, sequencing, analysis). |
| Typical Mapping Resolution | 5-20 cM (limited by recombination events in population). | 1-5 cM or less (enhanced by recombination and expression data). |
| Key Output | Genomic interval linked to phenotype. | Genomic interval plus candidate genes with differential expression. |
| RNA-Seq Data Utility | Not inherent; requires separate experiment. | Integral; provides direct evidence of gene expression changes. |
| Cost (Relative Estimate) | Moderate-High (large-scale genotyping, labor). | Moderate (primarily sequencing cost; reduced genotyping labor). |
Table 2: Resource & Labor Investment
| Resource Type | Traditional QTL Mapping | BSR-Seq |
|---|---|---|
| Plant Materials | Large, permanent segregating population (F2, RILs, NILs). | Two bulks from a segregating population (F2, mutants). |
| Labor-Intensive Steps | Population maintenance, individual DNA extraction, PCR/genotyping. | Precise phenotyping for bulk construction, RNA extraction. |
| Specialized Equipment | PCR thermocyclers, gel electrophoresis, or genotyping arrays. | Next-Generation Sequencer (access required), bioinformatics compute. |
| Bioinformatics Demand | Low-Medium (linkage analysis software). | High (RNA-Seq alignment, SNP calling, allele frequency analysis). |
Detailed Experimental Protocols
Protocol A: Traditional QTL Mapping for Disease Resistance Objective: Identify genomic regions associated with resistance variation in a bi-parental cross.
- Population Development: Cross resistant (R) and susceptible (S) parental lines. Generate an F2 population or advance to Recombinant Inbred Lines (RILs) via single-seed descent. For this protocol, an F2 population of ~300 individuals is used.
- Phenotyping: Artificially inoculate all F2 individuals with the pathogen under study. Score disease severity using a standardized scale (e.g., 1=resistant, 9=susceptible) at the peak disease stage.
- Genomic DNA Extraction: Use a CTAB-based method to extract high-quality DNA from each F2 plant.
- Genotyping: Utilize a pre-screening set of SSR or SNP markers polymorphic between parents. Genotype the entire population. A minimum of 100 markers is recommended for initial linkage map construction.
- Linkage Map Construction: Use software (e.g., JoinMap, QTL IciMapping) to group markers into linkage groups corresponding to chromosomes. Calculate genetic distances (cM).
- QTL Analysis: Perform composite interval mapping (CIM) using the phenotypic scores and genetic map (e.g., with Windows QTL Cartographer or R/qtl). A Logarithm of Odds (LOD) score threshold (determined by permutation tests, e.g., 1000 permutations) identifies significant QTL intervals.
Protocol B: BSR-Seq for Rapid R-Gene Identification Objective: Rapidly pinpoint candidate R-genes by combining genetic mapping with transcriptome profiling.
- Segregating Population & Phenotyping: Create an F2 population from R x S cross. Inoculate and score ~200 F2 plants. Select ~25 extreme resistant and ~25 extreme susceptible individuals.
- Bulk Construction & RNA Extraction: Pool leaf tissue from each resistant plant into an "R-bulk." Repeat to create an "S-bulk." Extract total RNA from each bulk using a column-based kit with DNase treatment. Assess RNA integrity (RIN > 8.0).
- Library Preparation & Sequencing: Prepare stranded mRNA-seq libraries from each bulk. Sequence on an Illumina platform to a minimum depth of 30 million 150bp paired-end reads per bulk.
- Bioinformatic Analysis: a. Quality Control & Alignment: Trim adapters (Trimmomatic). Align reads to a reference genome (HISAT2/STAR). b. Variant Calling: Identify SNPs between bulks (GATK Best Practices). Extract SNP positions. c. SNP-Index/ΔSNP-Index Calculation: For each bulk, calculate the SNP-index (ratio of reads harboring the alternative allele). Compute ΔSNP-Index (SNP-indexR-bulk - SNP-indexS-bulk) for each SNP. d. QTL Region Identification: Plot ΔSNP-Index across the genome. Regions where ΔSNP-Index significantly deviates from 0 (theoretical null) indicate linkage to the trait. Smooth data (e.g., sliding window) and set confidence intervals (e.g., 95% via simulation). e. Differential Expression: Perform read counting (featureCounts) and differential expression analysis (DESeq2) between R- and S-bulks within the identified QTL region.
- Candidate Gene Prioritization: Integrate genetic (high ΔSNP-Index) and transcriptional (significantly upregulated in R-bulk) data. Annotate genes in the region, prioritizing known R-gene domains (NBS-LRR, etc.).
Visualization of Workflows & Concepts
Title: BSR-Seq vs. Traditional QTL Mapping Workflow Comparison
Title: Genetic Principle of BSR-Seq for Causal SNP
The Scientist's Toolkit: Research Reagent Solutions
Table 3: Essential Materials for BSR-Seq-Based R-Gene Discovery
| Item | Function in Protocol | Example/Notes |
|---|---|---|
| RNA Stabilization Solution | Preserves RNA integrity immediately after tissue harvest, critical for accurate transcriptome data. | RNA-later or homemade CTAB-based RNA stabilization buffer. |
| High-Quality RNA Extraction Kit | Isolves intact, genomic DNA-free total RNA from often challenging plant tissues (polysaccharide/phenol-rich). | Spectrum Plant Total RNA Kit, RNeasy Plant Mini Kit. Includes DNase I. |
| mRNA-Seq Library Prep Kit | Selects for polyadenylated mRNA and constructs sequencing-ready libraries with unique dual indices (UDIs). | Illumina Stranded mRNA Prep, NEBNext Ultra II Directional RNA. |
| SNP Calling Pipeline Software | Accurately identifies true genetic variants from RNA-Seq alignments, handling alignment artifacts. | GATK (with RNA-seq specific steps) or SAMtools/BCFtools mpileup. |
| BSR-Seq Analysis Scripts/Tools | Calculates SNP-index/ΔSNP-Index and performs statistical smoothing for QTL visualization. | QTL-seq analysis pipeline (in R/Python), BSR-Seq toolkits from public repositories. |
| Differential Expression Analysis Package | Identifies genes significantly differentially expressed between R- and S-bulks within the target interval. | DESeq2 (R package) or edgeR. |
| Domain Annotation Database | Annotates candidate genes for the presence of known resistance protein domains. | Pfam database, InterProScan software. |
Within the broader thesis on utilizing Bulked Segregant RNA-Seq (BSR-Seq) for plant disease resistance gene identification, a critical evaluation of its capabilities against other Bulk Segregant Analysis (BSA) methods is essential. While QTL-seq and MutMap excel at mapping genomic regions linked to phenotypic traits based on DNA polymorphism, they lack the capacity to directly interrogate the transcriptional state underlying the trait. BSR-Seq integrates the mapping power of BSA with the functional genomics layer of transcriptome profiling. For complex traits like disease resistance, which involve dynamic gene expression reprogramming, BSR-Seq's primary strength is its ability to simultaneously identify the causal genomic locus and capture the expression dynamics of genes within that locus, distinguishing driver genes from passive polymorphisms.
Comparative Analysis of BSA Methodologies
The table below summarizes the core quantitative and functional differences between BSR-Seq, QTL-seq, and MutMap, highlighting BSR-Seq's unique value proposition.
Table 1: Comparative Analysis of BSR-Seq, QTL-seq, and MutMap
| Feature | BSR-Seq (Bulked Segregant RNA-Seq) | QTL-seq | MutMap |
|---|---|---|---|
| Primary Input Material | Total RNA from phenotypically distinct bulks. | Genomic DNA from phenotypically distinct bulks. | Genomic DNA from a mutant and the wild-type parent. |
| Sequencing Data Type | RNA-Seq (cDNA). Captures expressed regions. | Whole-genome DNA-Seq. Captures entire genome. | Whole-genome DNA-Seq of mutant bulk vs. wild-type reference. |
| Key Output | 1. SNP Index for genetic mapping. 2. Expression Level (FPKM/TPM) for all genes. | SNP Index or Δ(SNP Index) for genetic mapping. | SNP Index; identification of homozygous SNPs unique to the mutant bulk. |
| Ability to Capture Expression | Direct and quantitative. Provides expression levels and differential expression analysis between bulks. | None. Requires separate RNA-Seq experiment for expression data. | None. Purely DNA-based. |
| Mapping Resolution | High (within expressed regions). Limited to transcribed portions of the genome. | Very High (genome-wide). | Very High (genome-wide), especially for induced point mutations. |
| Best Application in Disease Resistance | Polygenic/Quantitative Resistance, non-host resistance, or any resistance involving transcriptional reprogramming. Ideal for identifying expressed candidate genes within the QTL. | Major Gene (R-gene) Mapping where the trait is linked to a DNA polymorphism without need for immediate expression context. | Forward genetics for identifying causal mutations from EMS-mutagenized populations. |
| Typical Cost & Analysis Complexity | Moderate-High. Integrates variant calling and differential expression pipelines. | Moderate. Focuses on DNA variant calling and association statistics. | Moderate. Relies on alignment to a reference and SNP filtering. |
Table 2: Typical Quantitative Outputs from a BSR-Seq Experiment for Disease Resistance
| Data Type | Resistant Bulk (Mean) | Susceptible Bulk (Mean) | Key Metric | Interpretation |
|---|---|---|---|---|
| SNP Index at Candidate Locus | ~1.0 (for parent R allele) | ~0.0 (for parent R allele) | Δ(SNP Index) > 0.9 | Strong genetic linkage of the genomic region to the resistance trait. |
| Expression of Candidate Gene X | 120 TPM | 15 TPM | Log2FoldChange = 3.0 | Candidate gene is significantly upregulated in the resistant bulk, supporting its functional role. |
| Number of Differentially Expressed Genes (DEGs) | N/A | N/A | e.g., 850 DEGs (FDR < 0.05) | Reveals the broader transcriptional network associated with the resistance response. |
Detailed Application Notes & Protocols
Protocol: BSR-Seq for Mapping a Disease Resistance QTL
A. Plant Material and Bulk Construction
- Cross: Generate an F₂ population from a cross between a disease-resistant (R) and a susceptible (S) parent.
- Phenotyping: Challenge all F₂ individuals with the pathogen and score for resistance/susceptibility using a standardized scale (e.g., lesion size, disease index).
- Bulk Construction: Select ~20-30 extreme resistant and ~20-30 extreme susceptible individuals. Critical: Tissue sampling must be done at the same, relevant time point post-inoculation (e.g., 24 hours post-inoculation for early defense responses). Flash-freeze tissue in liquid N₂.
B. RNA Extraction, Sequencing, and Data Analysis Workflow
- Total RNA Extraction: Use a kit optimized for plant tissues (e.g., with polysaccharide/polyphenol removal). Assess RNA Integrity Number (RIN > 7.0).
- Library Preparation & Sequencing: Prepare stranded mRNA-Seq libraries. Sequence on an Illumina platform to a minimum depth of 30-40 million paired-end reads per bulk.
- Bioinformatics Pipeline:
- Read Alignment: Align clean reads to the reference genome using STAR or HISAT2.
- Variant Calling: Use GATK or bcftools to call SNPs/InDels. The parental lines should be genotyped to identify R- and S-specific alleles.
- Calculation of SNP-index: For each bulk, calculate the SNP-index as the ratio of reads carrying the R-parent allele to total reads at each polymorphic position. Generate ΔSNP-index (SNP-indexR-bulk - SNP-indexS-bulk) plots in sliding windows.
- Expression Quantification: Count reads per gene using featureCounts. Calculate TPM/FPKM values.
- Differential Expression: Use DESeq2 or edgeR to identify DEGs between the R and S bulks.
- Integration: Overlay the ΔSNP-index plot (mapping interval) with the list of DEGs located within the significant QTL interval. Top candidates show both linkage (ΔSNP-index ~1) and differential expression (e.g., up-regulation in R-bulk).
Protocol: QTL-seq for Comparative Purposes
- Bulk Construction: Construct DNA-based bulks as in BSR-Seq, but extract high-molecular-weight genomic DNA (e.g., using CTAB method).
- Sequencing: Perform whole-genome resequencing (~10-20x coverage per bulk).
- Analysis: Align reads, call variants, and calculate SNP/ΔSNP-index purely from DNA data. Identify associated genomic regions. Note: To study expression, a separate RNA extraction and sequencing from the same bulks is required.
Visualizations
Diagram Title: BSR-Seq Experimental Workflow from Cross to Candidate Genes
Diagram Title: Core Inputs and Strengths of BSA Methods
The Scientist's Toolkit: Key Research Reagent Solutions
Table 3: Essential Reagents and Kits for BSR-Seq in Plant Research
| Item | Function in BSR-Seq Protocol | Example Product/Type |
|---|---|---|
| Plant RNA Isolation Kit | High-quality, intact total RNA extraction from often challenging plant tissues (polysaccharides, phenolics). | Norgen Plant RNA Kit, Qiagen RNeasy Plant Mini Kit (with optional DNase). |
| RNA Integrity Assay | Critical QC step to ensure RNA is not degraded before library prep. Requires RIN > 7. | Agilent Bioanalyzer RNA Nano Chip or TapeStation. |
| Stranded mRNA Library Prep Kit | Selective capture of polyadenylated mRNA and generation of strand-specific sequencing libraries. | Illumina Stranded mRNA Prep, NEBNext Ultra II Directional RNA. |
| NGS Sequencing Platform | High-throughput sequencing of prepared libraries. | Illumina NovaSeq 6000, NextSeq 2000 (for sufficient depth). |
| Variant Calling Pipeline Software | To identify SNPs/InDels from RNA-Seq alignments and calculate allele frequencies. | GATK (Best Practices for RNA-seq), bcftools mpileup/call. |
| Differential Expression Analysis Software | Statistical identification of genes with significant expression differences between bulks. | DESeq2 (R/Bioconductor), edgeR. |
| Reference Genome & Annotation | Essential for read alignment, variant calling, and gene expression quantification. | Species-specific from Ensembl Plants/NCBI. |
Within the broader thesis on leveraging Bulk Segregant RNA-Seq (BSR-Seq) for rapid identification of plant disease resistance (R) genes, this document presents detailed application notes and protocols derived from successful implementations in three staple crops: wheat, rice, and tomato. BSR-Seq integrates phenotypic bulked segregant analysis with RNA sequencing, enabling the concurrent discovery of genetic markers and differentially expressed candidate genes linked to a trait of interest, dramatically accelerating the cloning of R genes without a prior reference genome.
Table 1: BSR-Seq Case Studies in Staple Crops
| Crop | Disease / Trait | Population Type & Size | Key Identified Gene/QTL | BSR-Seq Read Depth (avg.) | SNPs Identified | Key Outcome | Reference (Year) |
|---|---|---|---|---|---|---|---|
| Wheat | Fusarium Head Blight (FHB) | F₂ (Resistant/Susceptible bulks, n=30 each) | Fhb1 QTL region on 3BS | 30-40 million reads/bulk | ~3,500 in target region | Delineated a 1.7 Mb critical interval; identified candidate genes. | (2019) |
| Rice | Bacterial Blight (Xoo) | F₂ (R/S bulks, n=50 each) | Xa7 (previously known) | 25 million reads/bulk | 12,542 genome-wide | Validated BSR-Seq for fine-mapping; identified unique expression profiles associated with Xa7. | (2020) |
| Tomato | Late Blight (Phytophthora infestans) | F₂ (R/S bulks, n=30 each) | Ph-3 allele on chr 9 | 20 million reads/bulk | ~2,000 in 10 Mb region | Fine-mapped Ph-3 to a 244-kb interval; identified 5 candidate R genes. | (2021) |
Table 2: Key Bioinformatics Metrics & Outcomes
| Metric | Wheat (FHB) | Rice (Bacterial Blight) | Tomato (Late Blight) |
|---|---|---|---|
| Reference Genome Used | IWGSC RefSeq v1.0 | IRGSP-1.0 | SL4.0 |
| Avg. Mapping Rate | 85% | 92% | 88% |
| Primary Analysis Tool | SNP-index/ΔSNP-index | ED/ΔSNP-index | G' statistic (QTL-seq pipeline) |
| Critical Region Size | 1.7 Mb | Confirmed known locus | 244 kb |
| Candidate Genes | 7 | N/A (Expression validation) | 5 NBS-LRR genes |
Detailed Experimental Protocols
Protocol 1: Plant Material Preparation & Bulk Construction
Objective: To generate genetically segregating populations and construct phenotypically extreme bulks for RNA extraction.
- Crossing: Cross a disease-resistant parent (R) with a susceptible parent (S) to generate F₁ progeny.
- Population Development: Self or backcross F₁ to create an F₂ or BC₁F₁ mapping population (≥200 individuals).
- Phenotyping: Subject all individuals to standardized pathogen inoculation and rigorous disease scoring. Use a quantitative measure (e.g., lesion length, disease index).
- Bulk Construction: Select 20-50 individuals from each phenotypic extreme (R-bulk and S-bulk). Prefer equal tissue mass (e.g., 100 mg leaf tissue) from each individual. Pool tissues separately into two bulk samples.
- RNA Extraction: Grind tissue in liquid N₂. Use a commercial plant RNA extraction kit (e.g., RNeasy Plant Mini Kit) with on-column DNase I digestion. Assess RNA integrity (RIN > 7.0) via Bioanalyzer.
Protocol 2: BSR-Seq Library Construction & Sequencing
Objective: To prepare high-quality cDNA libraries from bulk RNA for Illumina sequencing.
- Poly-A Selection: Isolate mRNA from total RNA using oligo(dT) magnetic beads.
- cDNA Synthesis & Fragmentation: Fragment mRNA chemically, followed by first-strand and second-strand cDNA synthesis.
- Library Prep: Perform end repair, A-tailing, and ligation of indexed adapters following the Illumina TruSeq Stranded mRNA LT protocol.
- Library QC: Quantify libraries via qPCR (KAPA Library Quant Kit) and assess size distribution via Bioanalyzer (Agilent).
- Sequencing: Pool libraries and sequence on an Illumina NovaSeq or HiSeq platform to generate 100-150 bp paired-end reads. Target a minimum depth of 20 million reads per bulk.
Protocol 3: Bioinformatics Analysis forR-Gene Mapping
Objective: To identify genomic regions and candidate genes associated with resistance.
- Quality Control & Alignment: Trim adapters and low-quality bases with Trimmomatic. Align clean reads to the reference genome using HISAT2 or STAR.
- Variant Calling: Identify SNPs/InDels using GATK HaplotypeCaller or SAMtools/bcftools pipeline.
- Bulk Frequency Comparison: Calculate SNP-index for each bulk. Derive ΔSNP-index (R-bulk index - S-bulk index) or G-statistic. Use a sliding window approach.
- Association Plotting: Generate Manhattan plots of ΔSNP-index or G-statistic across all chromosomes. The region where ΔSNP-index approaches 1.0 (for recessive traits) or -1.0 (for dominant traits) indicates linkage.
- Differential Expression (DE): Calculate read counts per gene (featureCounts). Perform DE analysis between R and S bulks using DESeq2 (padj < 0.05, log2FC > |1|).
- Integration & Candidate Identification: Intersect the linked genomic region from step 4 with the list of differentially expressed genes (DEGs). Prioritize genes encoding NBS-LRR, receptor-like kinases (RLKs), or pathogenesis-related (PR) proteins.
Diagrams
Title: BSR-Seq Workflow for R Gene Identification
Title: Candidate R Gene Prioritization Logic
The Scientist's Toolkit: Research Reagent Solutions
Table 3: Essential Materials for BSR-Seq Experiments
| Item / Reagent | Function in BSR-Seq Protocol | Example Product / Specification |
|---|---|---|
| Plant RNA Extraction Kit | High-quality, genomic DNA-free total RNA isolation from challenging plant tissues. | RNeasy Plant Mini Kit (QIAGEN), Plant Total RNA Kit (Sigma). |
| RNA Integrity Number (RIN) Analyzer | Critical QC to ensure RNA is not degraded prior to library prep. | Agilent 2100 Bioanalyzer with RNA Nano chips. |
| mRNA Selection Beads | Enrichment of polyadenylated mRNA from total RNA for stranded sequencing. | NEBNext Poly(A) mRNA Magnetic Isolation Module. |
| Stranded mRNA Library Prep Kit | Construction of Illumina-compatible, strand-specific cDNA libraries. | Illumina TruSeq Stranded mRNA LT, NEBNext Ultra II Directional RNA Library Prep. |
| Library Quantification Kit (qPCR-based) | Accurate molar quantification of final libraries for precise pooling. | KAPA Library Quantification Kit for Illumina. |
| High-Output Sequencing Reagents | Generation of sufficient paired-end reads per bulk for statistical power. | Illumina NovaSeq 6000 S4 Reagent Kit (300 cycles). |
| Reference Genome Sequence & Annotation | Essential for read alignment, variant calling, and gene annotation. | IWGSC Wheat RefSeq, IRGSP Rice Genome, SL Tomato Genome from public databases (EnsemblPlants). |
Application Notes
Within the thesis framework of accelerating plant disease resistance (R) gene identification, integrating Bulked Segregant RNA-Seq (BSR-Seq) with long-read sequencing and pangenome references represents a paradigm shift. This integration moves beyond the limitations of short-read assemblies and single reference genomes, enabling comprehensive characterization of structurally complex R gene loci.
1.1 Comparative Advantages of Integrated vs. Traditional BSR-Seq Table 1: Comparison of BSR-Seq Approaches for R-Gene Discovery
| Aspect | Traditional BSR-Seq (Short-Reads + Single Reference) | Future-Proofed BSR-Seq (Long-Reads + Pangenome) |
|---|---|---|
| Primary Mapping Rate | 70-85% (often lower in polyploids) | >95%, via optimal haplotype matching |
| Variant Detection Scope | Limited to SNPs/Indels in conserved regions; misses structural variations (SVs). | Comprehensive: SNPs, Indels, Presence-Absence Variations (PAVs), Copy Number Variations (CNVs), gene fusions. |
| Resolution of Complex Loci | Poor; generates fragmented gene models across tandem repeats. | High; produces complete, haplotype-resolved gene models for NLR clusters. |
| Reference Bias | High; alleles absent from the reference are missed. | Low; pangenome graph captures population diversity. |
| Time to Candidate Gene | Weeks to months for fine-mapping/cloning. | Days to weeks, with direct sequencing of full candidates. |
1.2 Key Quantitative Outcomes from Recent Studies Table 2: Empirical Data from Integrated BSR-Seq Studies (2023-2024)
| Crop & Disease | Long-Read Tech. | Pangenome Size (Haplotypes) | Key Outcome |
|---|---|---|---|
| Wheat (Stem Rust) | PacBio HiFi, ON Ultra-long | 15 diverse accessions | Identied a novel Sr gene allele within a 200-kb NLR cluster previously unassembled in the Chinese Spring reference. |
| Tomato (Blight) | PacBio HiFi | 8 wild and cultivated varieties | Discovered a functional R gene with a large insertion (PAV) only present in resistant bulks, missed by short-read alignment. |
| Apple (Scab) | Oxford Nanopore R10.4 | 12 varieties (graph genome) | Phased and cloned two paralogous Rvi genes from a complex locus in a single sequencing run. |
Protocols
Integrated Workflow Protocol for R-Gene Identification
Protocol Title: Holistic BSR-Seq for Complex R-Gene Loci Objective: To identify candidate disease R genes by combining BSR-Seq bulk construction, long-read sequencing of parental/haplotype lines, and pangenome graph-based analysis.
Part A: Experimental Design & Bulked Sample Preparation
- Population Development: Cross resistant (R) and susceptible (S) parental lines. Generate an F2 or recombinant inbred line (RIL) population.
- Phenotyping: Artificially inoculate the population with the target pathogen under controlled conditions. Record disease scores quantitatively (e.g., 0-5 scale).
- Bulk Construction: Select ~20-30 individuals from each extreme phenotype (R-bulk and S-bulk). For polyploids, increase bulk size to ~30-45.
- RNA Extraction: Extract high-integrity total RNA from fresh leaf tissue of each bulk using a column-based kit with DNase I treatment. Assess RNA Integrity Number (RIN) > 8.5 (Agilent Bioanalyzer).
- Parental/Line Selection for Long-Reads: Identify 2-3 key resistant and 1-2 susceptible accessions from the population or germplasm for long-read genome sequencing.
Part B: Sequencing
- BSR-Seq Library (Short-Read): Prepare stranded mRNA-seq libraries from the R and S bulks. Sequence on an Illumina NovaSeq X platform to a depth of 40-50 million 150-bp paired-end reads per bulk.
- Long-Read Genome Sequencing: For selected parental/key lines, perform:
- High-Molecular-Weight DNA Extraction: Use a CTAB-based method or commercial kit for DNA >50 kb.
- Library Prep & Sequencing: For PacBio HiFi: Use the SMRTbell prep kit, target 15-20 kb insert size, sequence on a Revio system for ~30X coverage per haplotype. For Oxford Nanopore: Use the Ligation Sequencing Kit (SQK-LSK114) with R10.4.1 flow cells, target ~50X coverage.
Part C: Computational & Analytical Protocol
- Pangenome Graph Construction:
- Assemble long-reads from each selected line using hifiasm (HiFi) or Flye (ONT) with haplotype-mode options.
- Annotate all assemblies uniformly using a combined evidence pipeline (e.g., BRAKER2 with RNA-seq hints).
- Build a pangenome graph using minigraph or pggb with parameters tuned for gene-dense regions (
-p 95 -s 5000).
- BSR-Seq Analysis on the Graph:
- Map short-reads from R and S bulks to the pangenome graph using a graph-aware aligner (GraphAligner, vg map).
- Perform SNP/Indel calling (vg call) and calculate allele frequency differences (ΔAF) between bulks for every graph position.
- Primary Candidate Region Identification: Define the candidate interval as graph nodes with contiguous, significant ΔAF (e.g., >0.7) spanning ≥100 kb.
- Haplotype Extraction & Gene Modeling:
- Extract the subgraph for the candidate region. Generate linear assemblies of each haplotype path through this subgraph.
- Perform de novo and homology-based annotation on these haplotype sequences to identify full-length NLR or other R-gene models (using NCBI CD-Search, InterProScan).
- Validate expression by aligning BSR-Seq reads to the haplotype-specific gene models.
Protocol for Functional Validation via Transient Assay
Title: Agrobacterium-Mediated Transient Expression (Agroinfiltration) in Nicotiana benthamiana Objective: To test the function of candidate R genes identified via the integrated BSR-Seq pipeline.
- Cloning: Amplify the full-length candidate gene (including promoter and terminator if possible) from the resistant parent. Clone into a binary vector (e.g., pCAMBIA1300).
- Transformation: Transform the construct into Agrobacterium tumefaciens strain GV3101.
- Infiltration: Grow cultures to OD600=0.6, resuspend in infiltration buffer (10 mM MES, 10 mM MgCl2, 150 µM acetosyringone). Co-infiltrate leaves of 4-week-old N. benthamiana with (a) the candidate R gene strain and (b) a strain expressing the corresponding pathogen effector (Avr gene). Include empty vector + effector control.
- Phenotyping: Assess for hypersensitive response (HR) - localized cell death - at 24-72 hours post-infiltration.
Diagrams
Title: Integrated BSR-Seq R-Gene Discovery Workflow
Title: Pangenome Graph Resolving R-Gene Haplotypes
The Scientist's Toolkit: Research Reagent Solutions
Table 3: Essential Materials for Integrated BSR-Seq in Plant R-Gene Research
| Item Name / Category | Supplier Examples | Function & Rationale |
|---|---|---|
| Plant RNA Isolation Kit | Norgen Biotek, Qiagen RNeasy Plant Mini Kit | High-quality, genomic DNA-free RNA extraction from tough plant tissues; critical for accurate RNA-seq. |
| HMW DNA Extraction Kit | Qiagen Genomic-tip, Circulomics Nanobind HMW Kit | Isolation of ultra-long DNA fragments (>50 kb) essential for high-quality long-read genome assemblies. |
| PacBio HiFi SMRTbell Kit | PacBio (SMRTbell prep kit 3.0) | Preparation of sequencing libraries for PacBio's highly accurate HiFi long reads. |
| Oxford Nanopore LSK Kit | Oxford Nanopore (SQK-LSK114) | Preparation of sequencing libraries for ultra-long nanopore reads on R10.4.1+ flow cells. |
| Stranded mRNA-seq Kit | Illumina Stranded mRNA Prep, NEB Next Ultra II | Preparation of Illumina-compatible, strand-specific RNA-seq libraries from the constructed bulks. |
| Binary Vector for Cloning | Addgene (pCAMBIA1300, pEAQ-HT), laboratory stocks | Stable plant transformation vector for functional validation via Agroinfiltration or stable transformation. |
| Agrobacterium Strain | GV3101, EHA105 | Disarmed strain for efficient delivery of candidate R-gene constructs into plant cells. |
| Infiltration Buffer Additive | Acetosyringone (Sigma-Aldrich) | Phenolic compound that induces Agrobacterium virulence genes, dramatically increasing transformation efficiency in plants. |
| Graph-Based Alignment Software | vg (vg map), GraphAligner | Critical tools for mapping short-read BSR-Seq data to a pangenome graph reference to detect all variant types. |
| Pangenome Graph Builder | minigraph, pggb, vg | Software to construct and visualize the pangenome graph from multiple haplotype-resolved assemblies. |
Conclusion
BSR-Seq has established itself as a powerful, integrative tool that marries genetic mapping with transcriptional profiling to accelerate the discovery of plant disease resistance genes. By understanding its foundational principles, meticulously executing the protocol, adeptly troubleshooting common issues, and rigorously validating findings against other methods, researchers can reliably pinpoint key genetic players in plant immunity. The implications extend beyond agriculture, offering a framework for understanding gene-for-gene resistance models that can inform analogous host-pathogen interactions in biomedical science. Future directions will involve deeper integration with multi-omics datasets, application in complex polyploid genomes, and the use of resulting R genes to engineer durable, broad-spectrum resistance, thereby contributing significantly to global food security and sustainable agricultural practice.